On March 24, Databricks announced Lakewatch - a SIEM built natively on the Lakehouse. Detection rules, investigation workflows, threat intelligence, all running on Delta tables and Unity Catalog. For anyone who’s been building security analytics on Databricks, this isn’t surprising. It’s confirmation. The Security Data Lake isn’t a cheaper SIEM alternative anymore. It’s becoming the platform.
This is the direction I’ve been pushing for a while. My threat hunting app runs on Databricks. My detection-as-code framework stores rules in YAML and tests them against Delta tables. The data pipeline I built for this demo uses Zerobus Ingest through NiFi to land security telemetry directly into Delta.
Lakewatch will handle detection. Spark Declarative Pipelines keep the plumbing healthy. But there’s a gap between those two that neither is designed to fill.
The gap nobody talks about #
Databricks already gives you solid observability over your data pipelines. SDP data quality expectations will tell you when a column has unexpected NULLs. You’ll get notified when a pipeline fails entirely. Schema drift gets caught before bad data hits your gold tables.
All of that works well for pipeline health. The problem is a different kind of failure.
You have a thousand endpoints pushing security telemetry through your ingestion pipeline. One of them stops reporting. Maybe an EDR agent crashed. Maybe someone rotated a credential and the agent can’t authenticate. Maybe a firewall rule changed and the host can’t reach the collector.
The pipeline is green. Data quality checks pass. Throughput barely dips - 999 out of 1,000 sources are still reporting. SDP expectations are met. Lakewatch detects threats in the data that arrives. Everything looks healthy.
Except one endpoint is now completely unmonitored, and nobody noticed for three days.
This isn’t a pipeline problem. It’s a visibility problem. The pipeline works fine. The data that arrives is valid. The issue is what’s not arriving.
Pipeline monitoring tells you the pipe works. Asset-level monitoring tells you nothing is missing.
SilentPulse #
This is what I’ve been building with SilentPulse. It monitors security telemetry at the asset level - per host, per feed, per source. It compares what should be reporting against what actually is. When a source goes silent, SilentPulse catches it.
Over the past few weeks, I connected it natively to Databricks. Not as a separate tool that sends webhook alerts, but as a first-class data source that plugs into the Lakehouse ecosystem.
The integration has three packages:
- silentpulse-datasource - a PySpark DataSource that lets you read SilentPulse data with
spark.read.format("silentpulse") - silentpulse-sdp - observability decorators for Spark Declarative Pipelines
- silentpulse-uc-discovery - Unity Catalog asset discovery
All open source, Apache 2.0: github.com/silentpulse-io/silentpulse-databricks
The rest of this post is a full walkthrough. Real pipeline, real data, real failure simulation.
The demo environment #
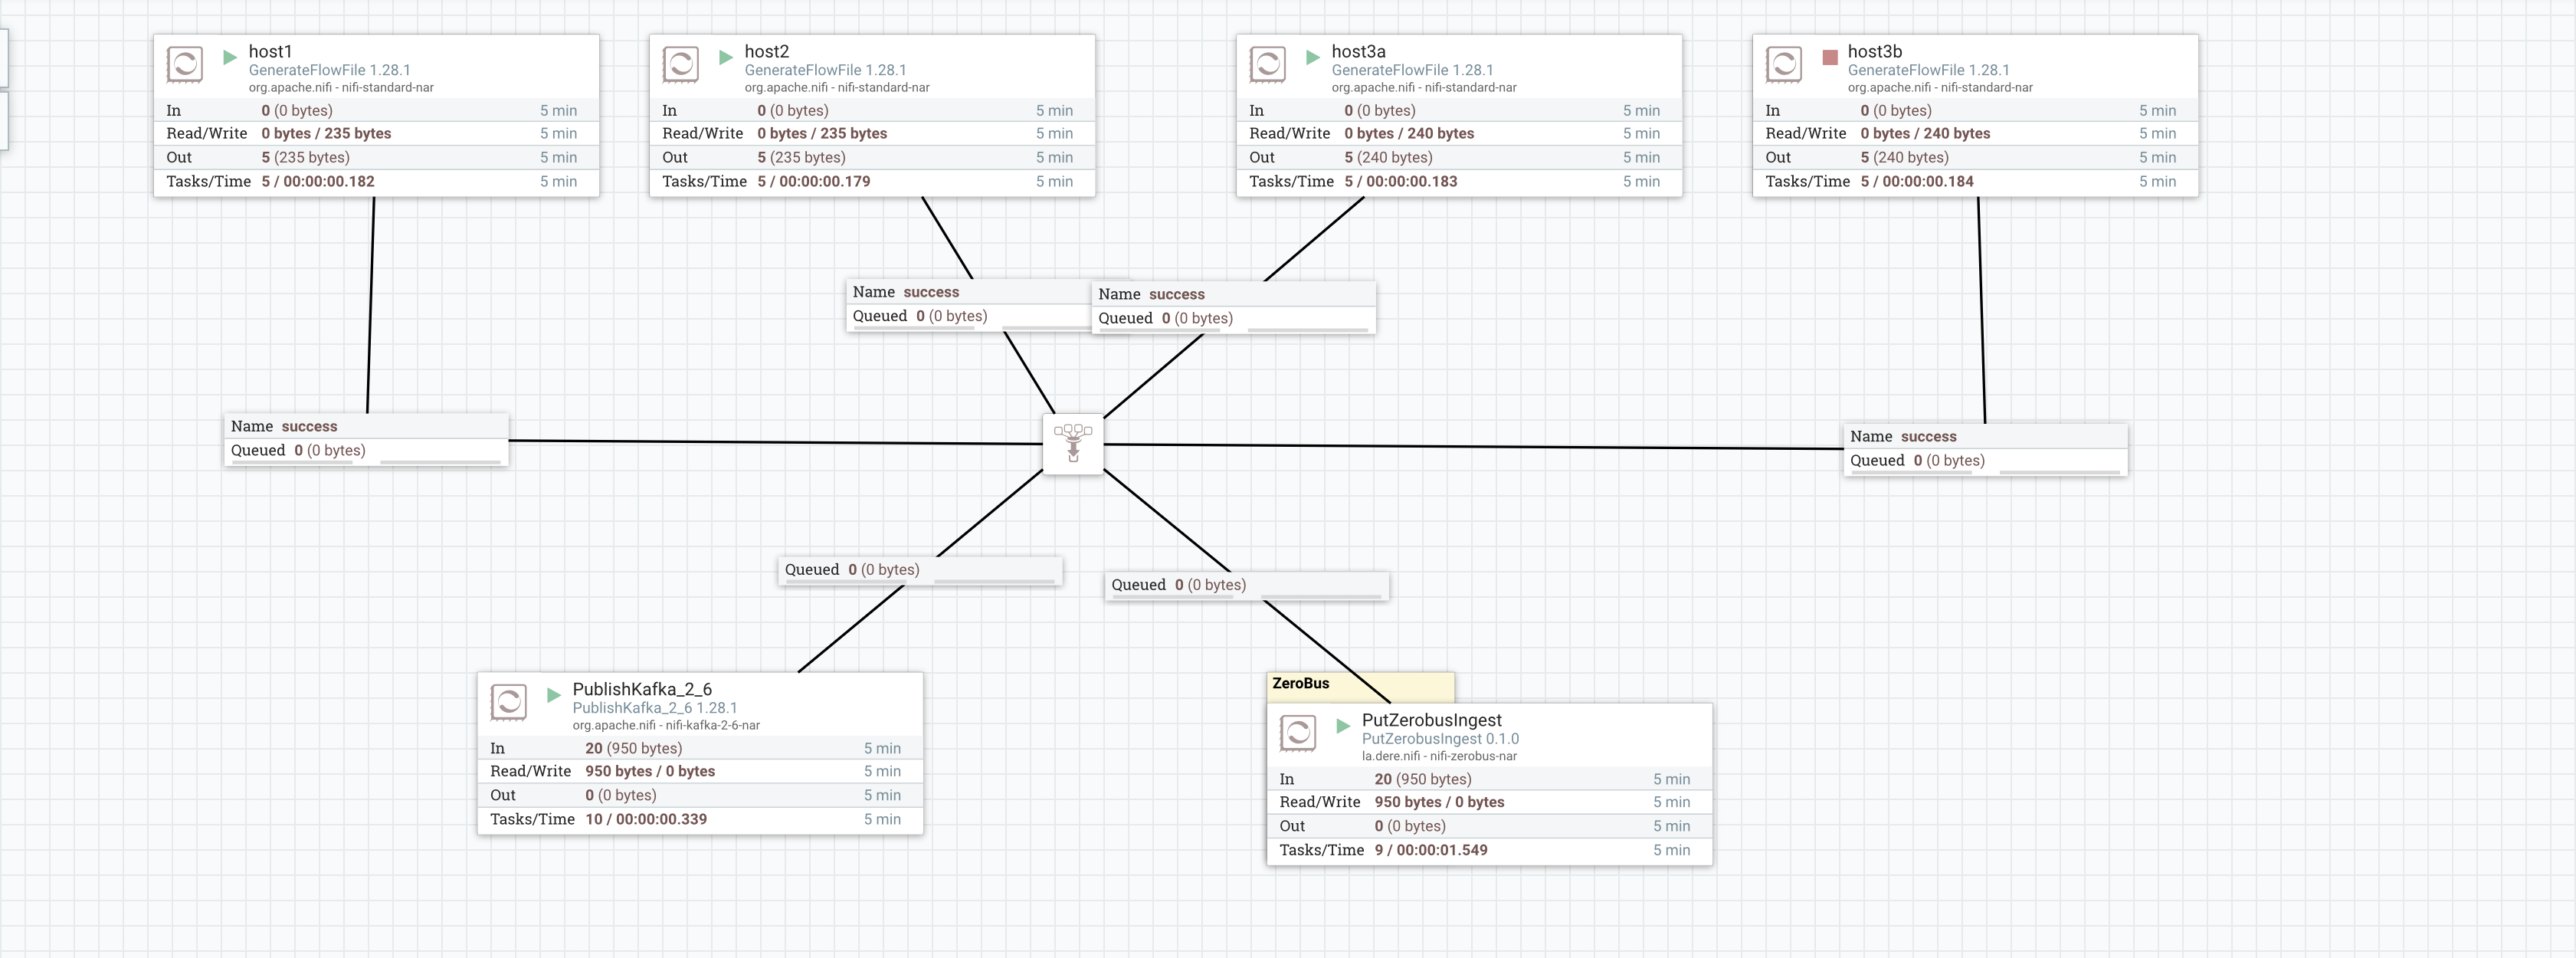
I’m using the same NiFi + Zerobus Ingest pipeline from my previous post. Four hosts (host1, host2, host3a, host3b) generate security telemetry continuously. NiFi routes it through MergeContent and PutZerobusIngest into a Delta table at demo.default.zerobus_ingestion.
NiFi (host1, host2, host3a, host3b)
  -> MergeContent
  -> PutZerobusIngest
  -> Databricks (demo.default.zerobus_ingestion)
SilentPulse monitors all four hosts. If any of them stops reporting, SilentPulse creates a silence alert.
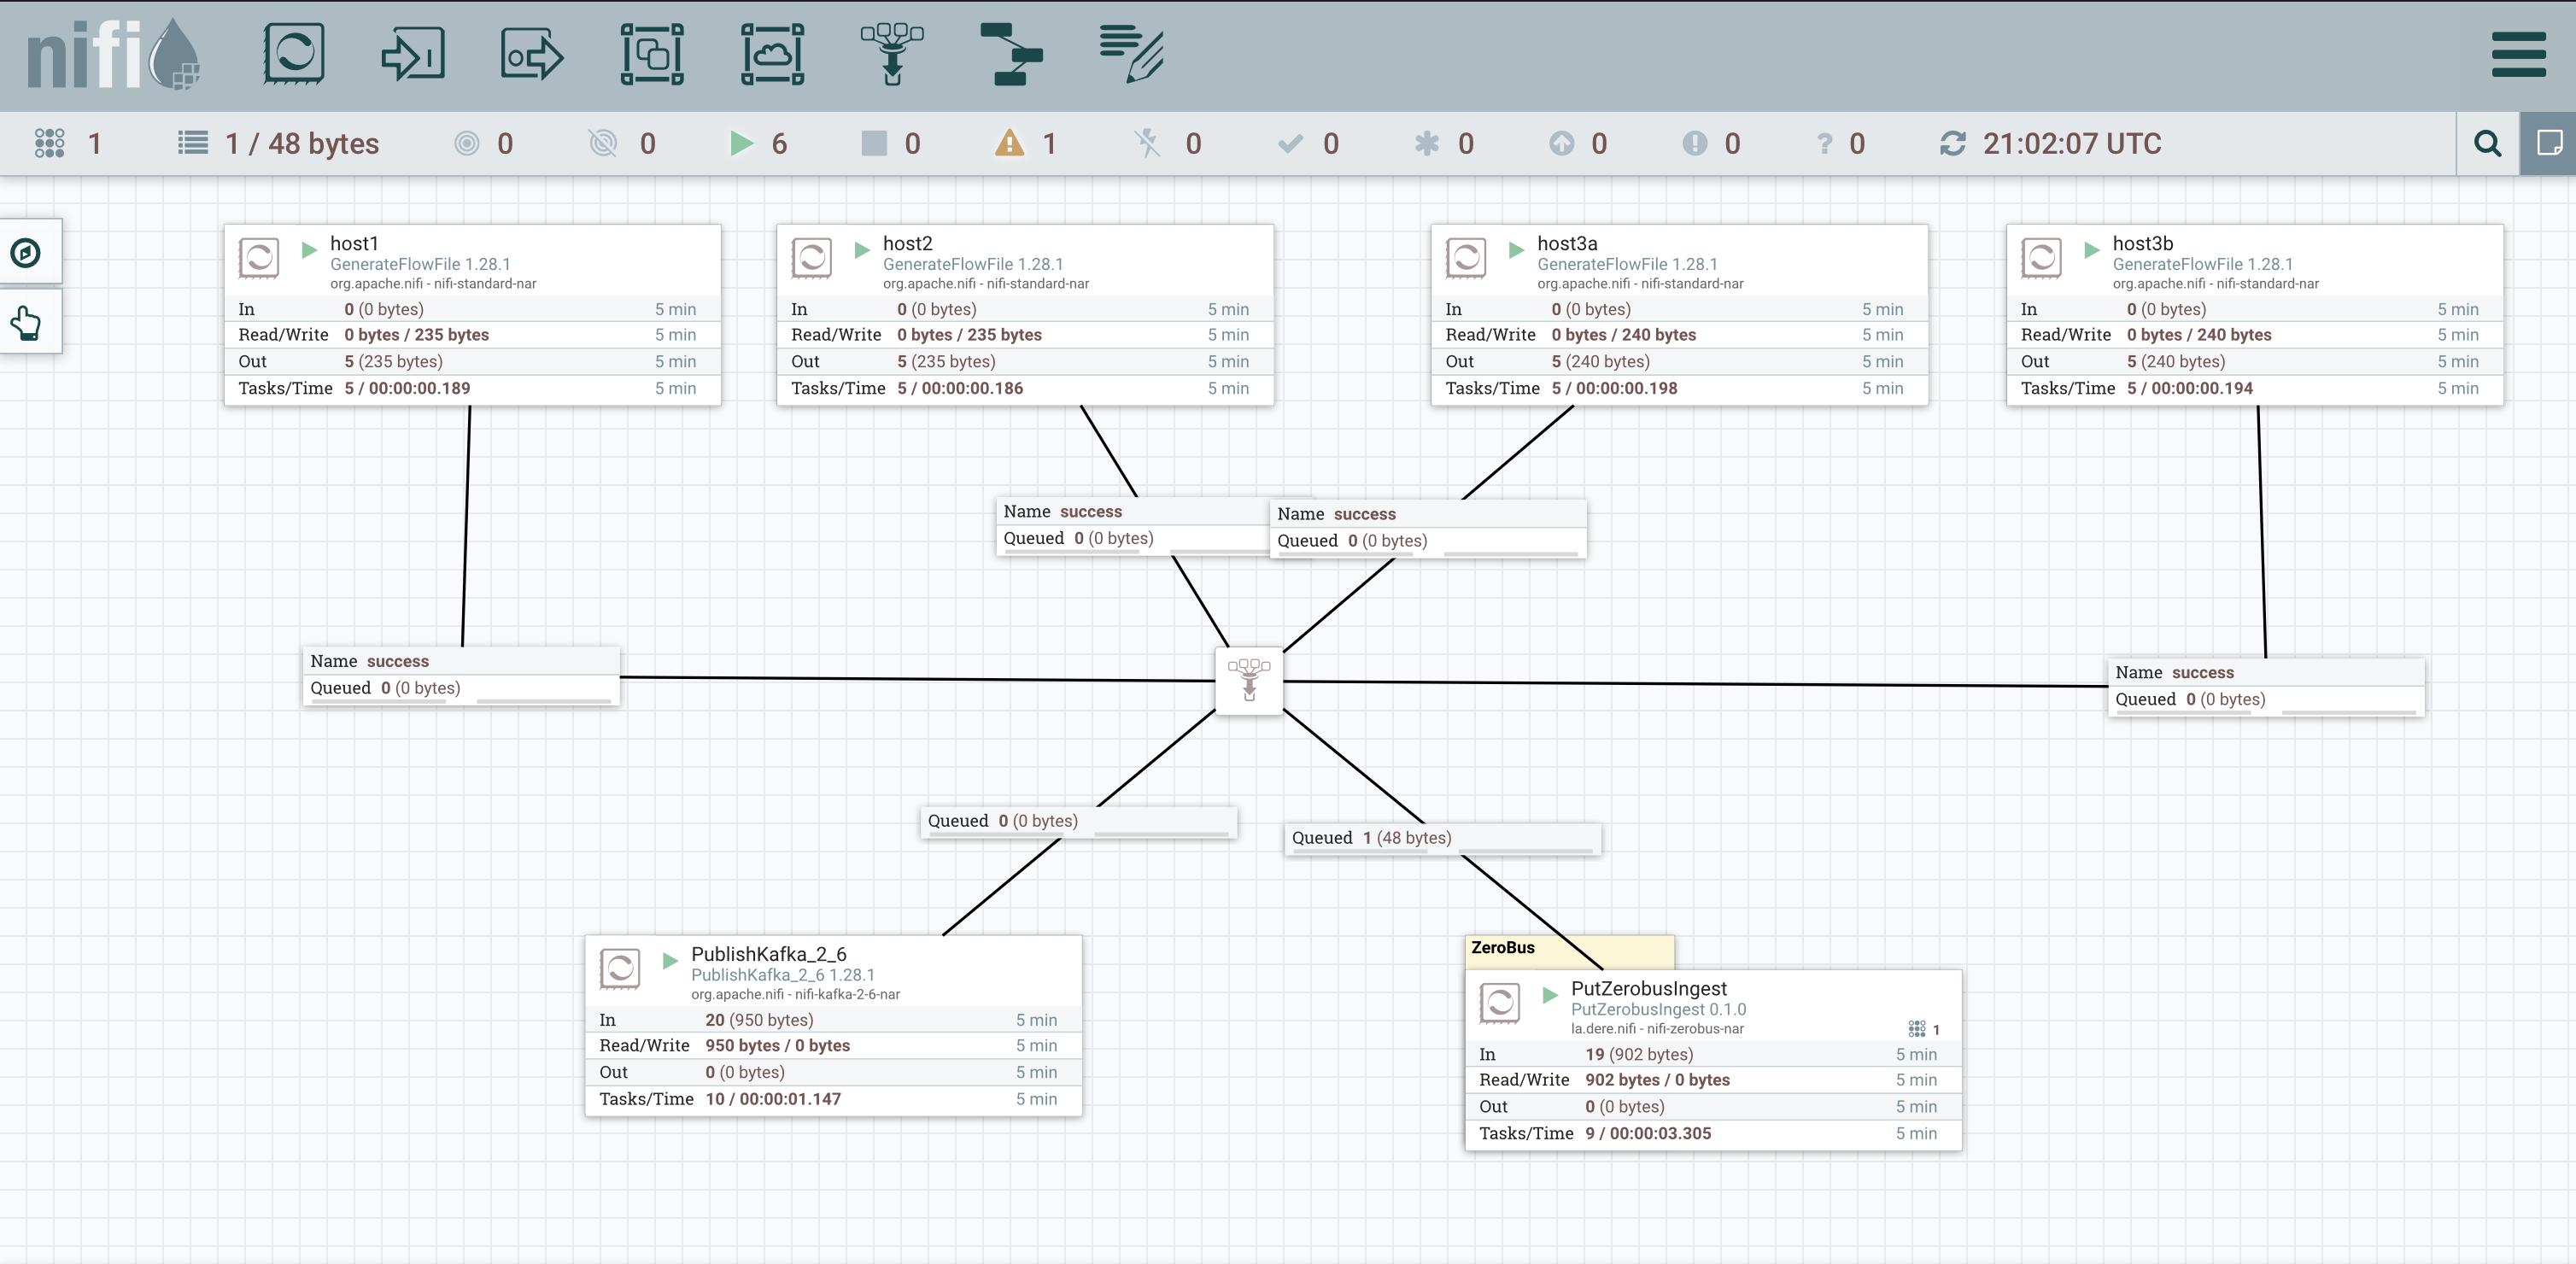
Before anything else, verify the data is flowing:
|
|
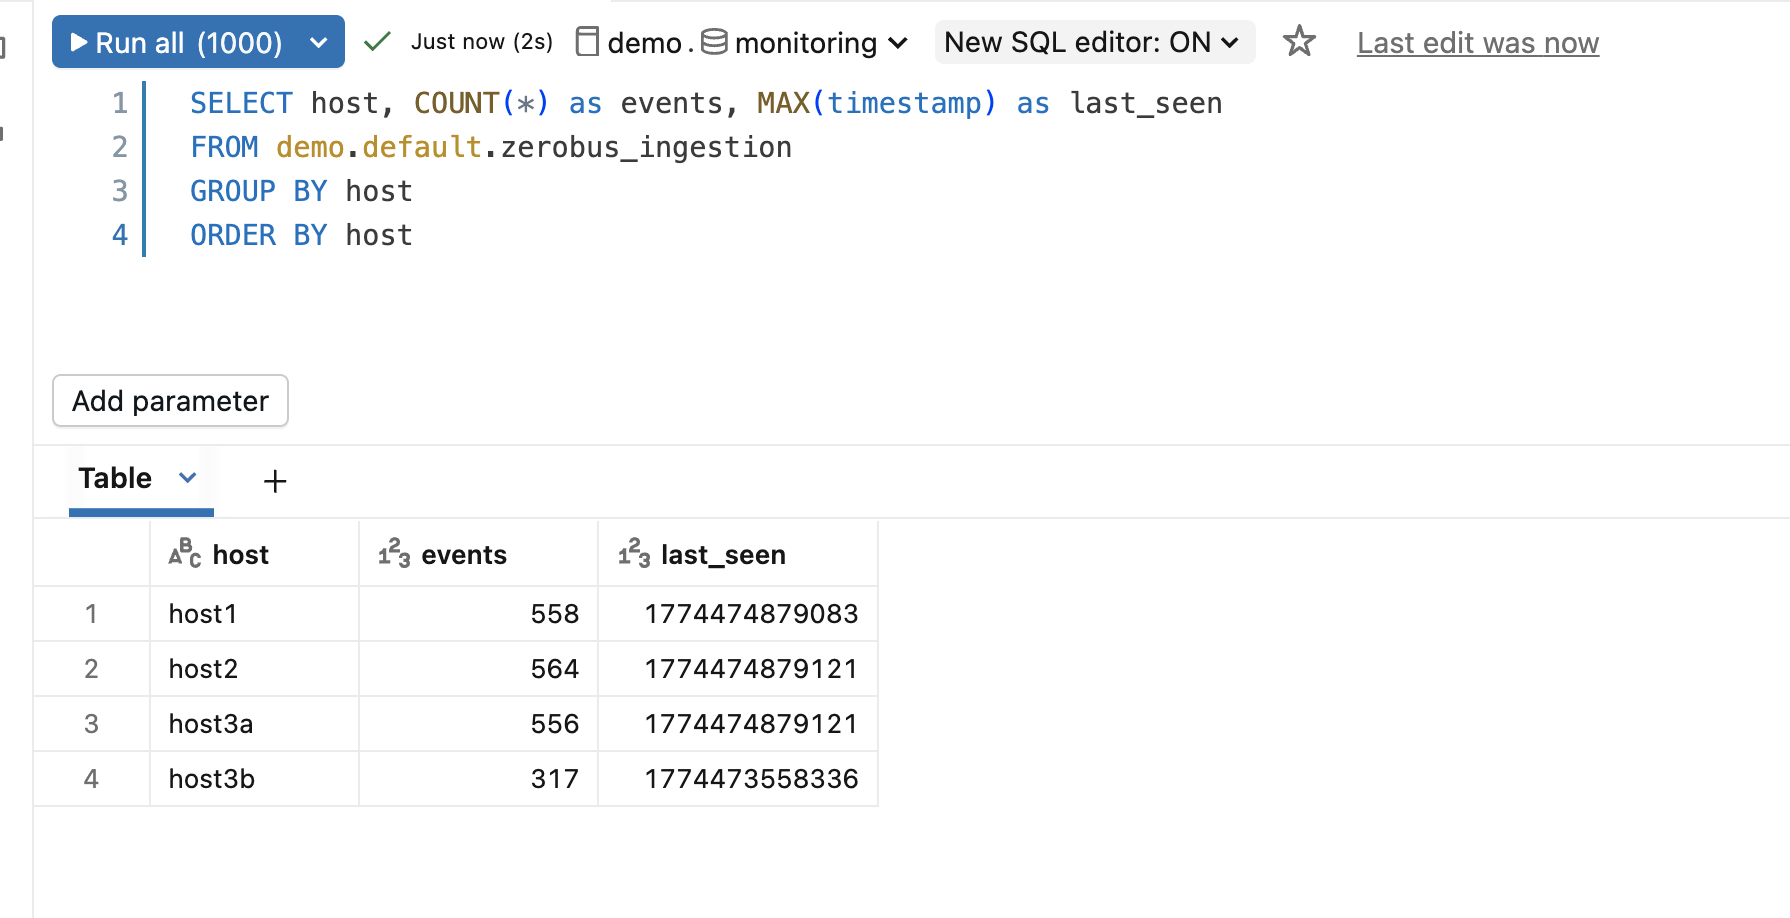
Four hosts, all reporting. This is our baseline.
Part 1: Reading SilentPulse data in Spark #
The DataSource package installs from a wheel stored in a Unity Catalog Volume:
|
|
Register the data source and connect:
|
|
Now read alerts like any other data source:
|
|
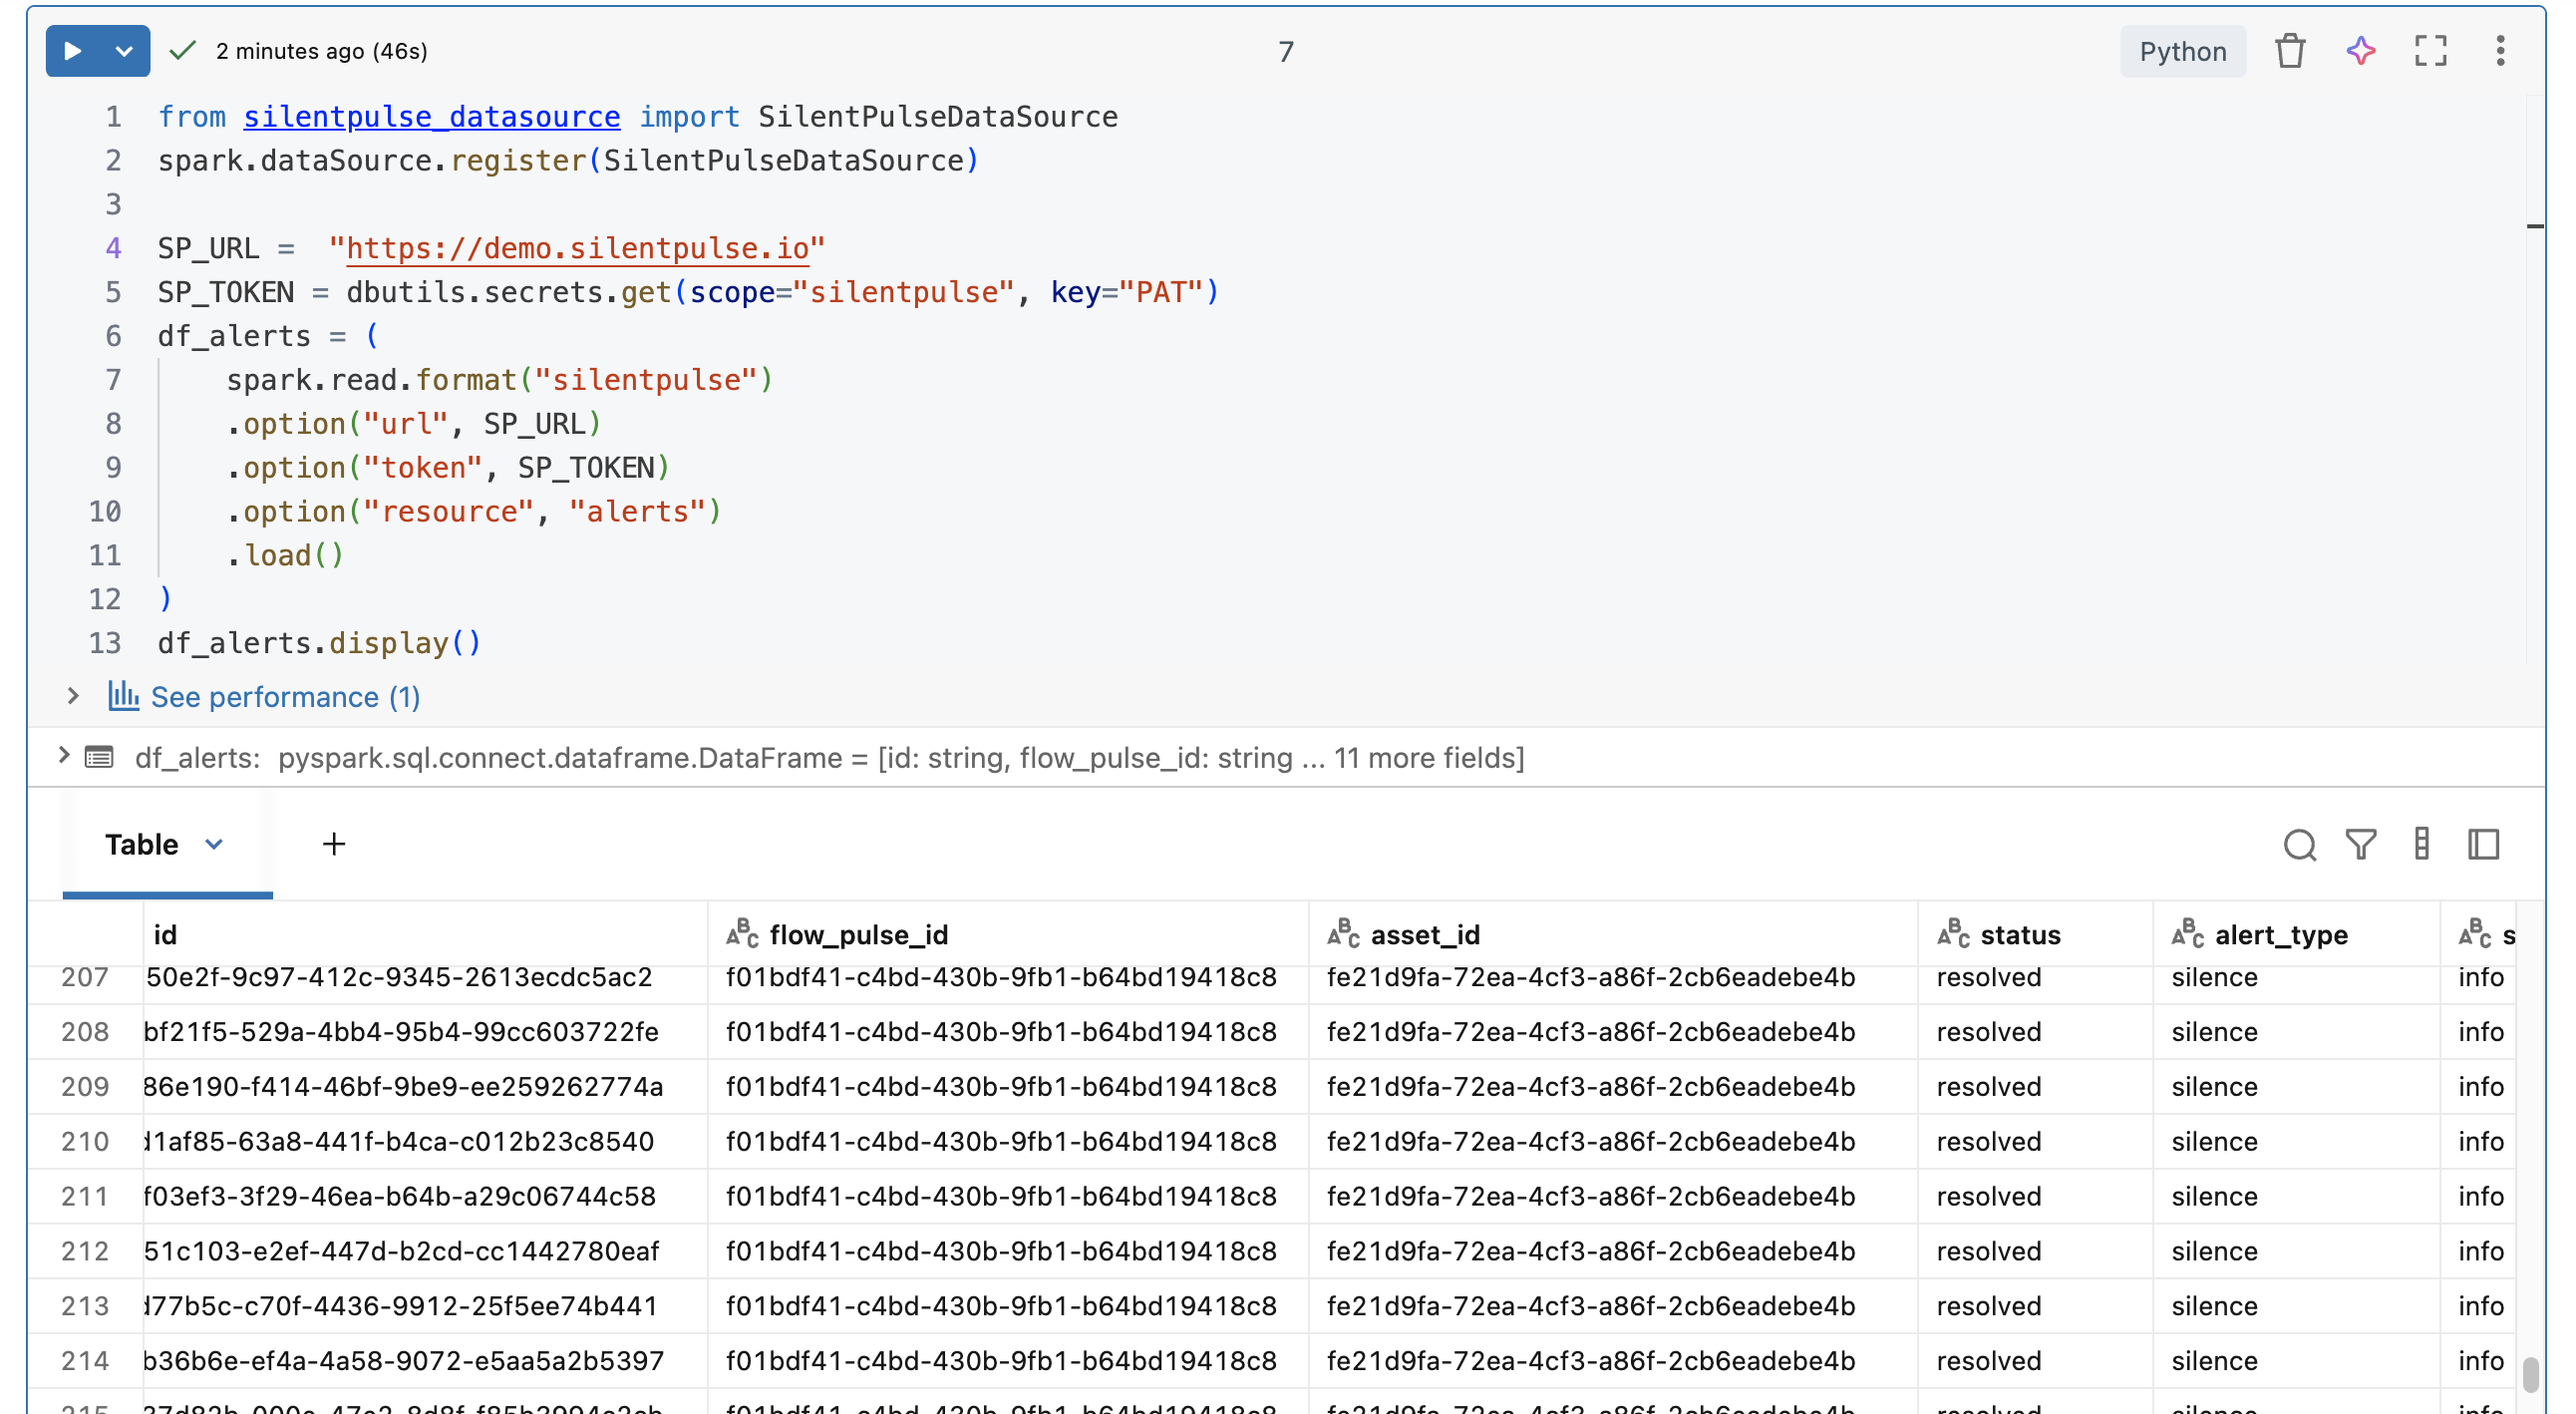
One line of code. The DataSource handles pagination, authentication, retry with exponential backoff on transient errors, and schema mapping. Under the hood it’s a full PySpark DataSource V2 implementation with batch reader, stream reader (for alerts), and stream writer (for telemetry ingest). The batch reader paginates through the SilentPulse API, yielding rows that map directly to the DataFrame schema.
Same pattern for pipeline coverage:
|
|
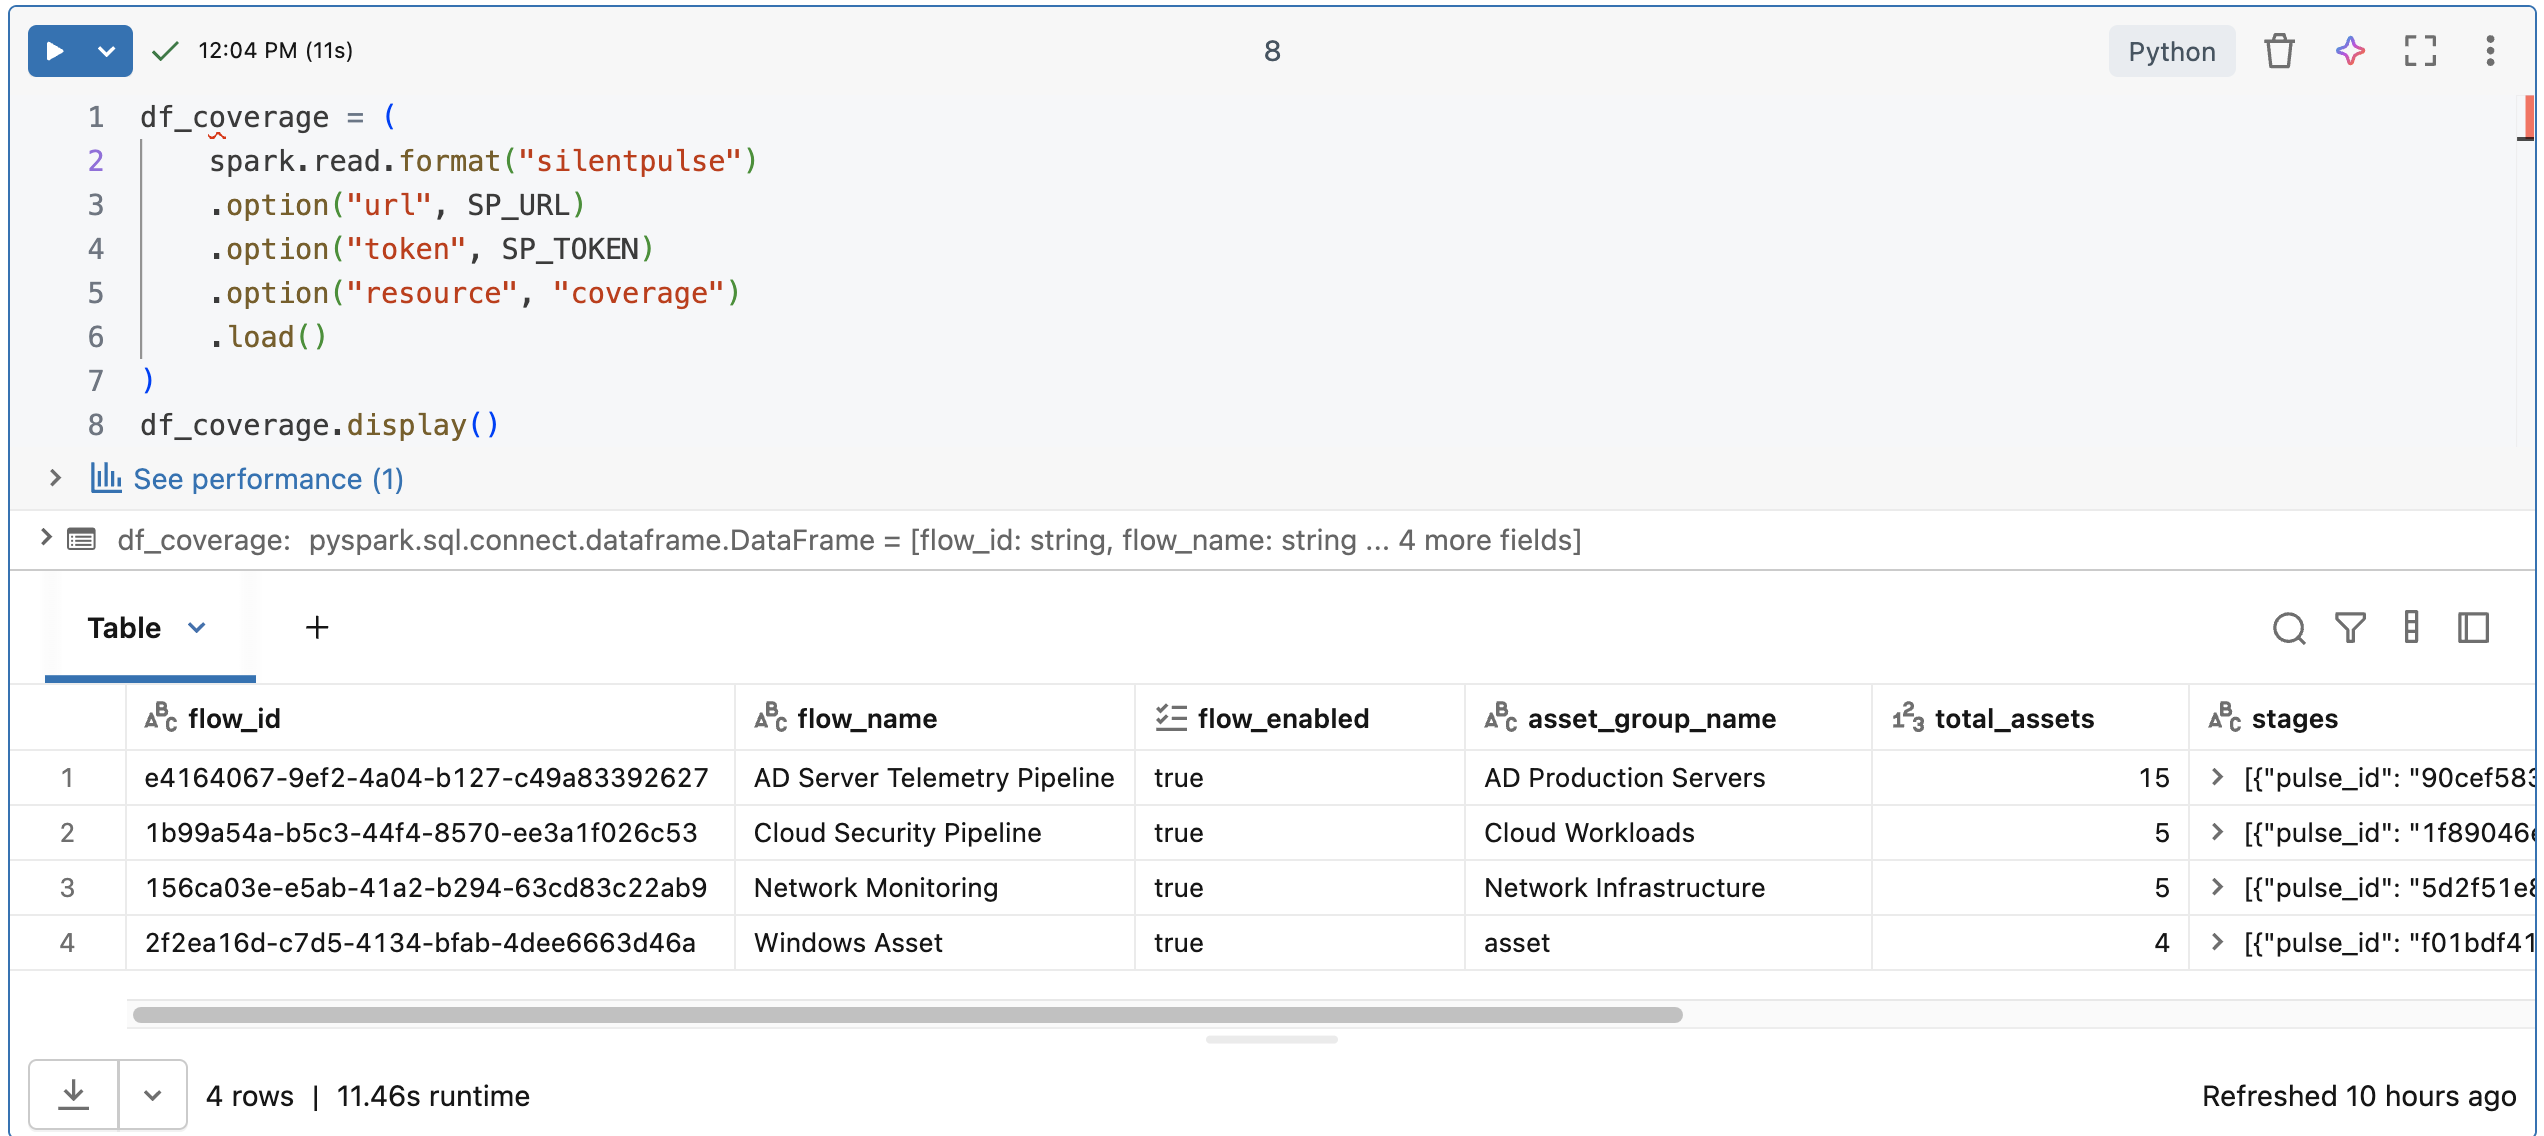
Five resources are available: alerts, flows, entities, observations, and coverage. Each maps to a SilentPulse API endpoint with a predefined schema.
Materializing to Delta #
Read once, write to Unity Catalog, query forever:
|
|
Now the visibility data sits alongside your security telemetry in Unity Catalog. Same governance, same access controls, same query engine.
Joining both worlds #
This is where it gets interesting. The raw events from Zerobus and the visibility metadata from SilentPulse, side by side:
|
|
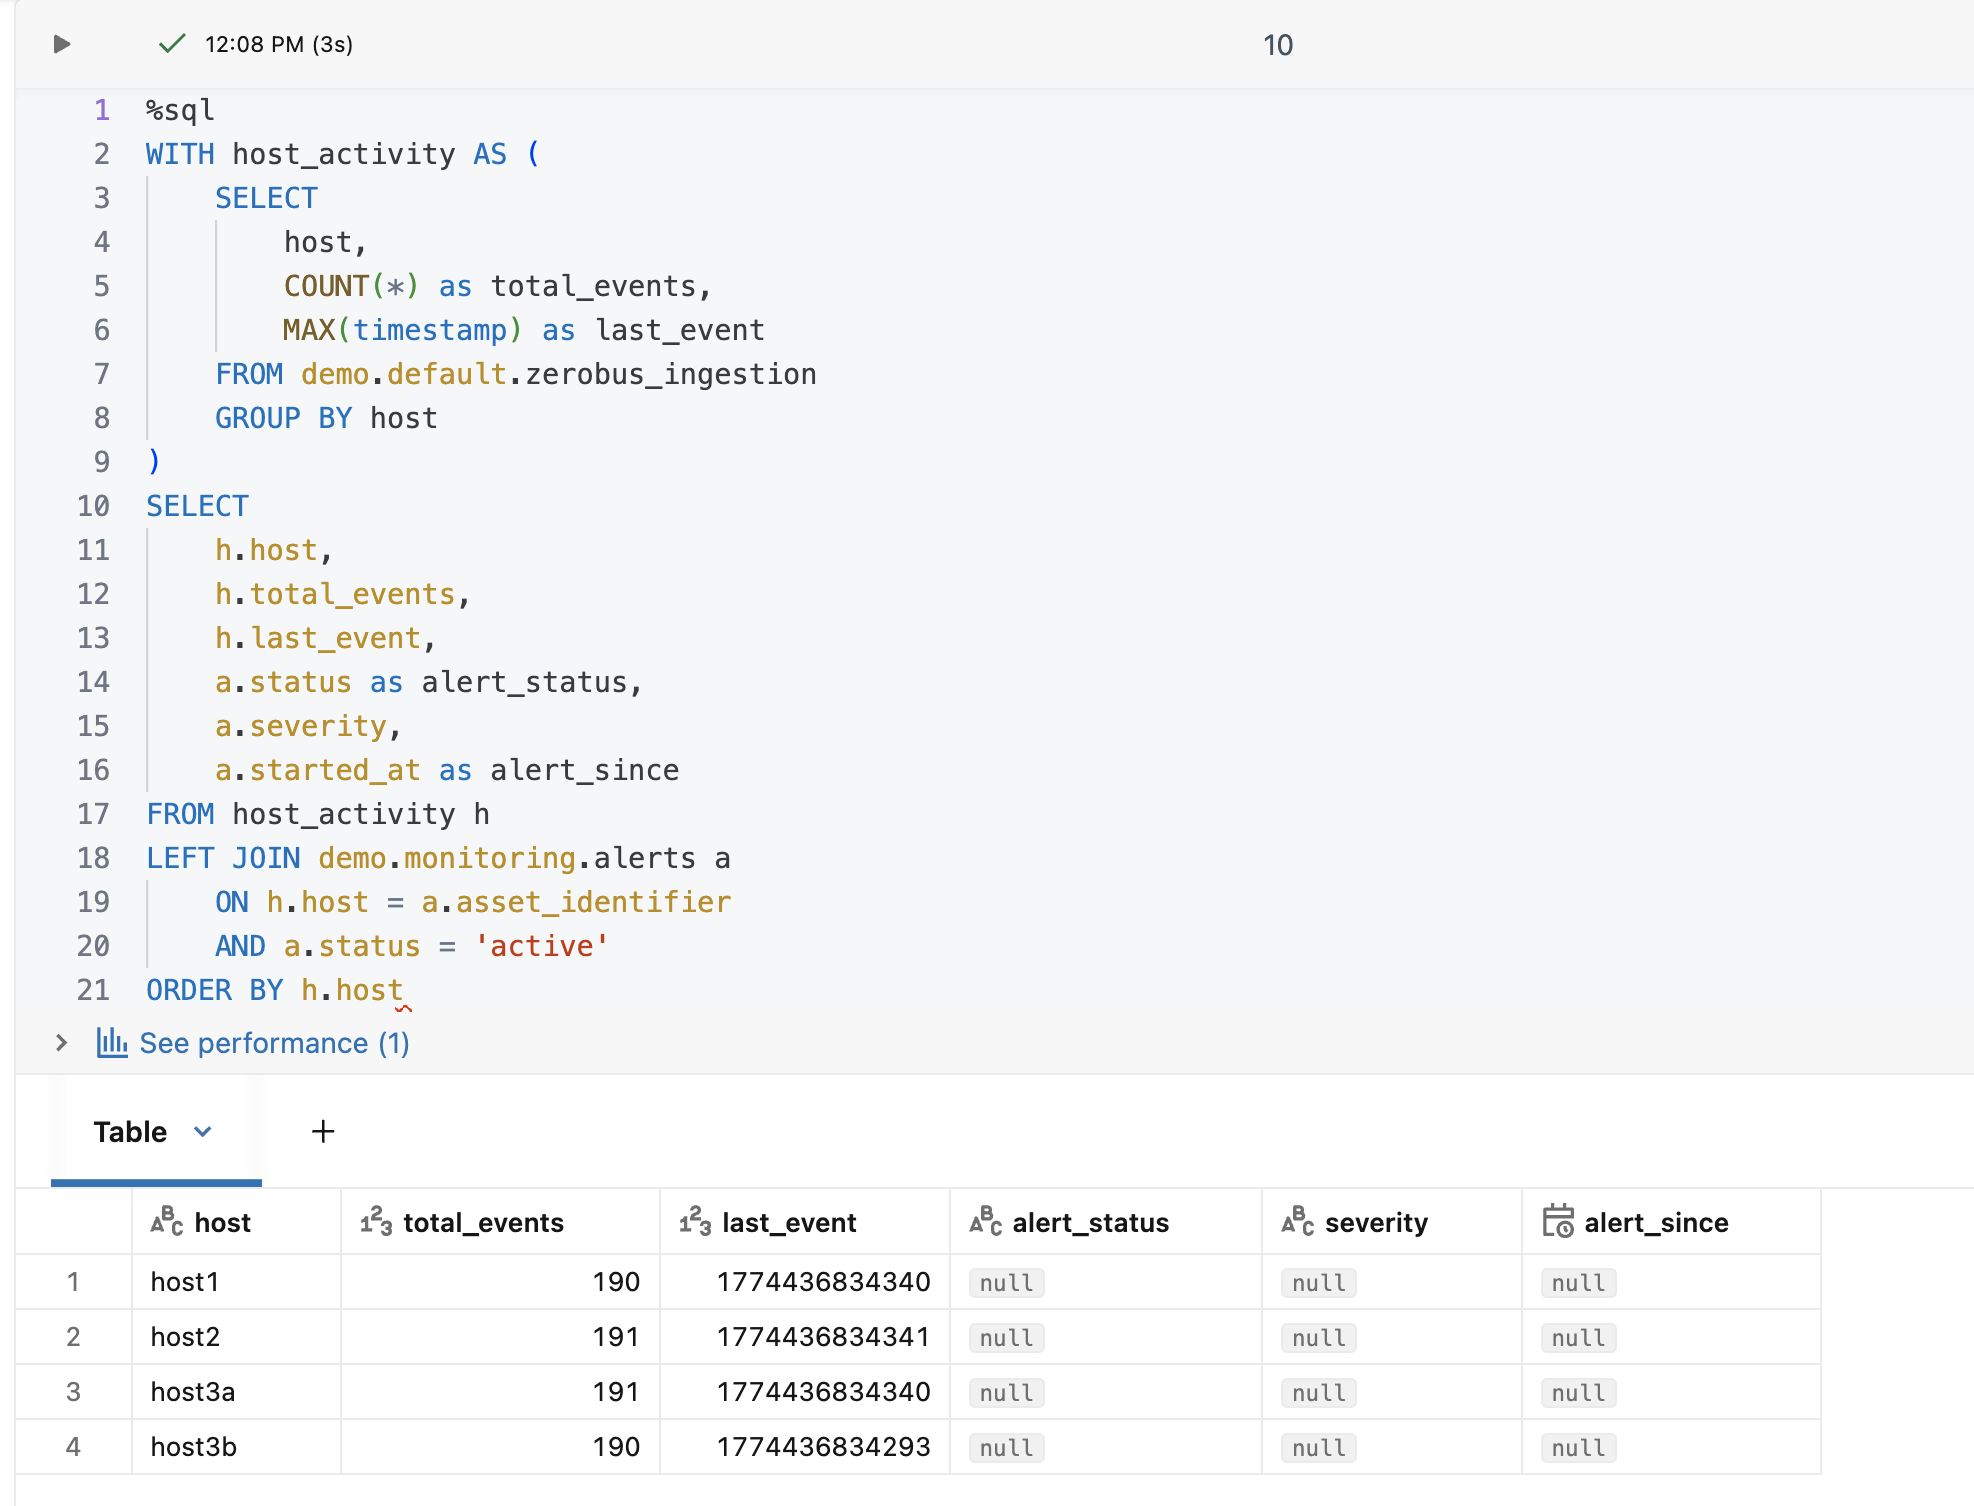
One query that shows both what your hosts are sending and whether SilentPulse has flagged any of them. If a host has events but also an active alert, something changed recently. If a host has no events and an active alert, it went dark.
Part 2: Breaking things on purpose #
Theory is nice. Let’s break something.
In NiFi, I stop the processor for host3b. The other three hosts keep generating events. The pipeline stays green. Zerobus keeps ingesting. Data quality checks pass.
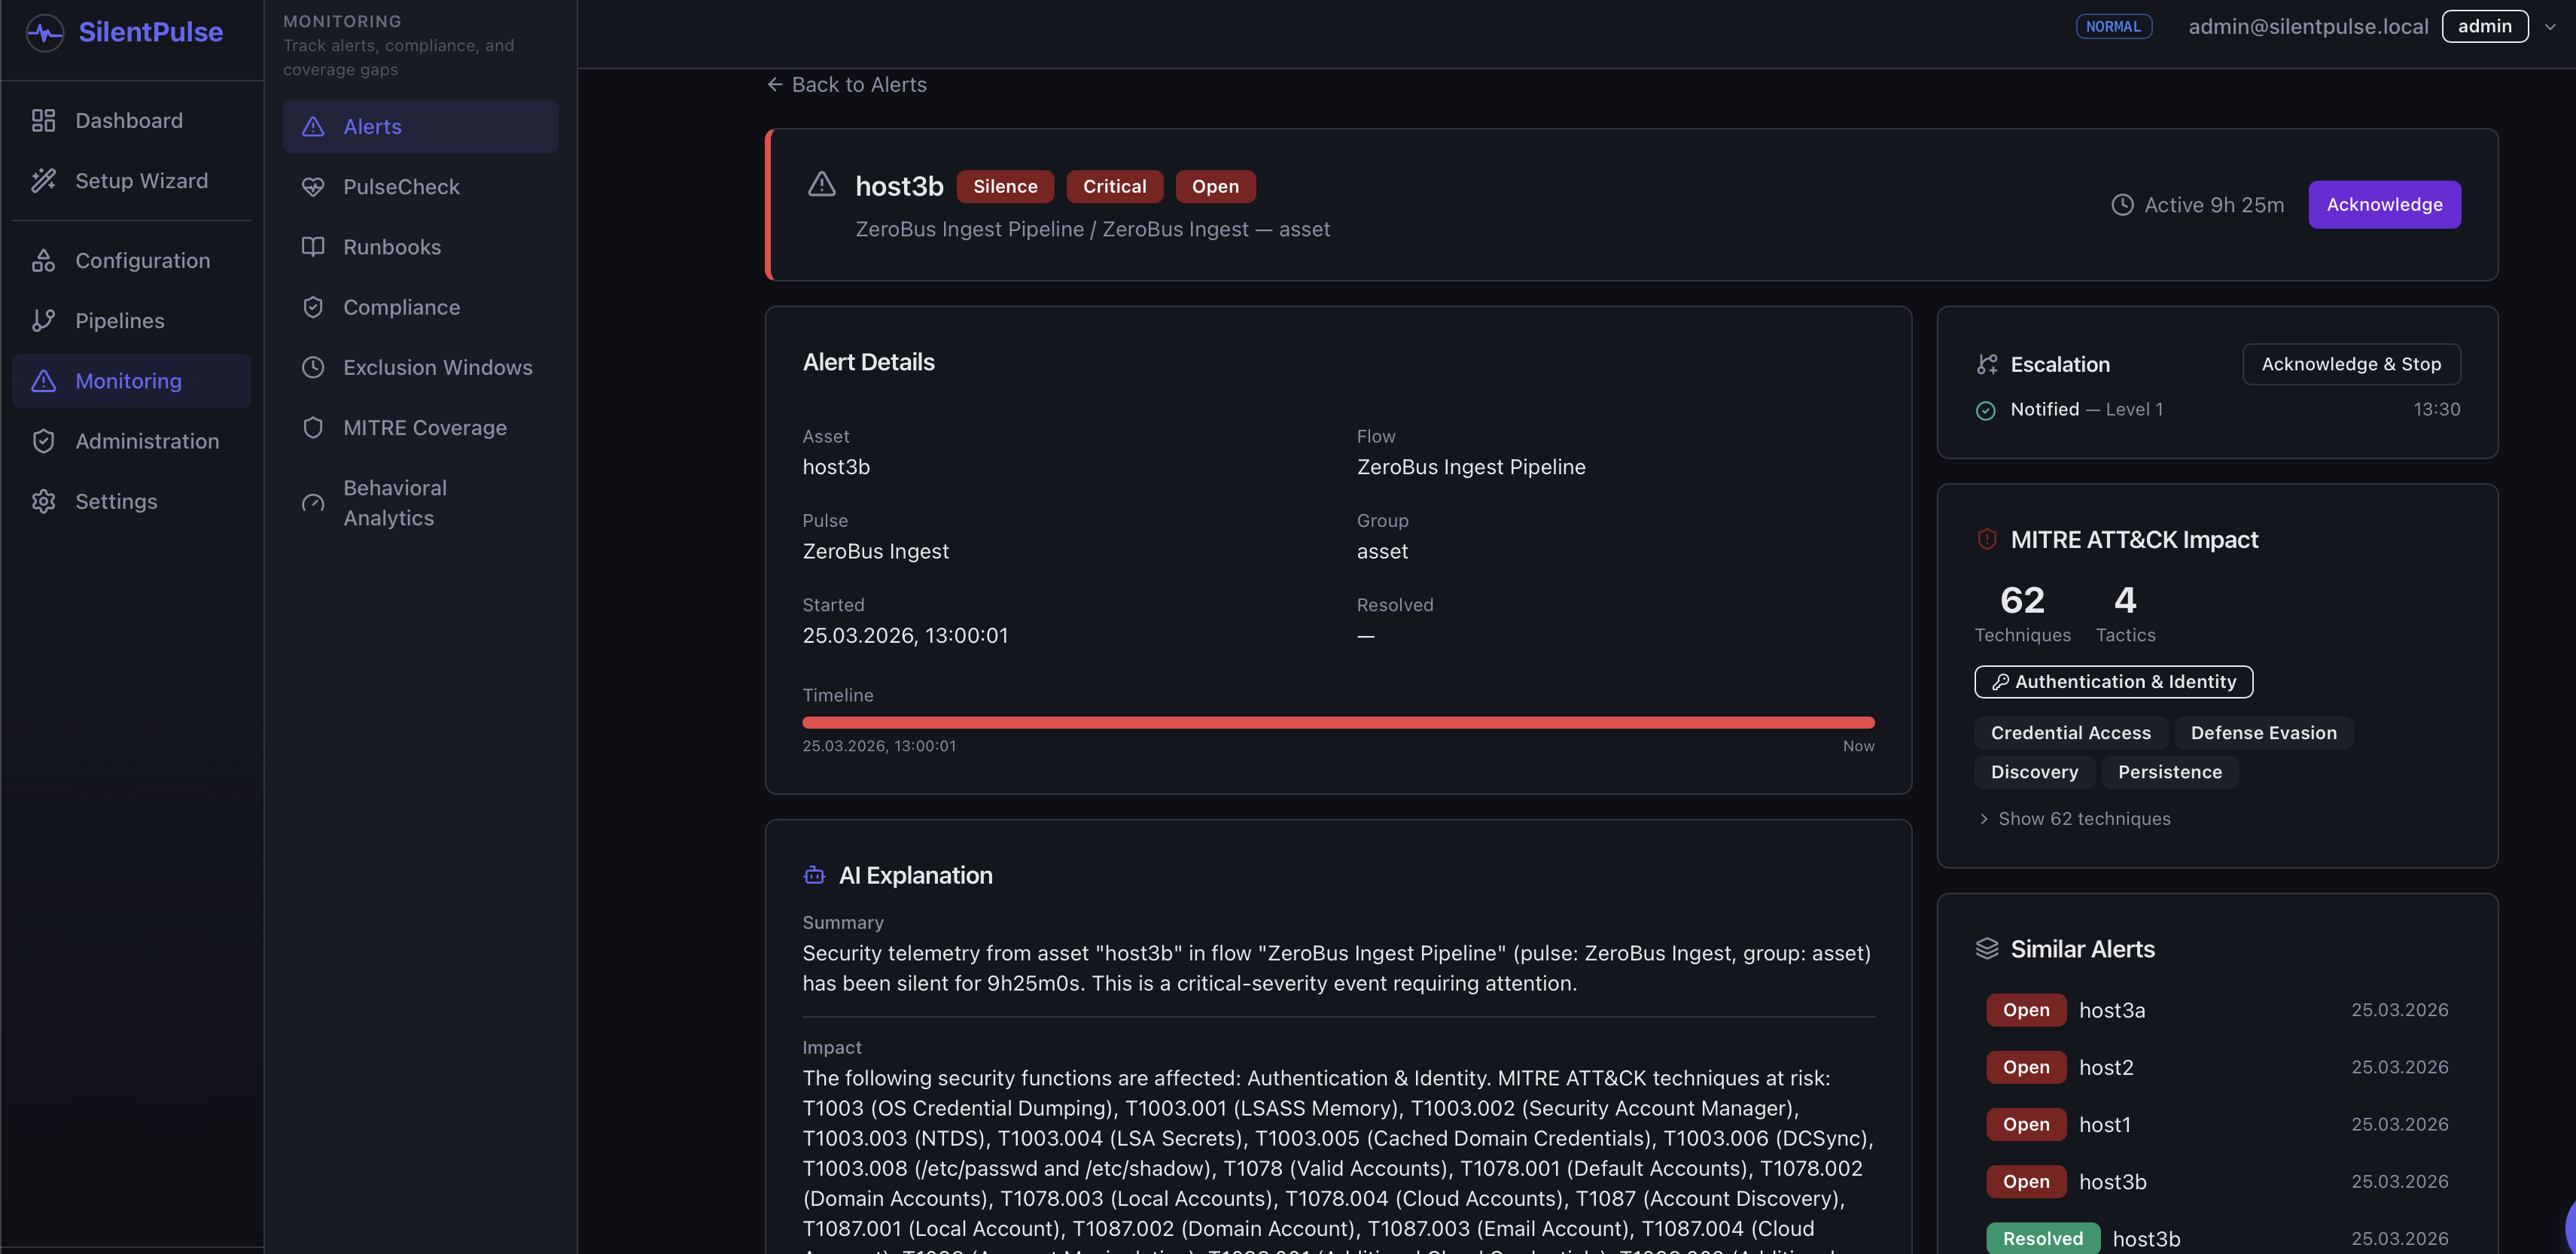
After a few minutes, SilentPulse detects the silence. A new alert appears in the SilentPulse UI:
Back in Databricks, refresh the data:
|
|
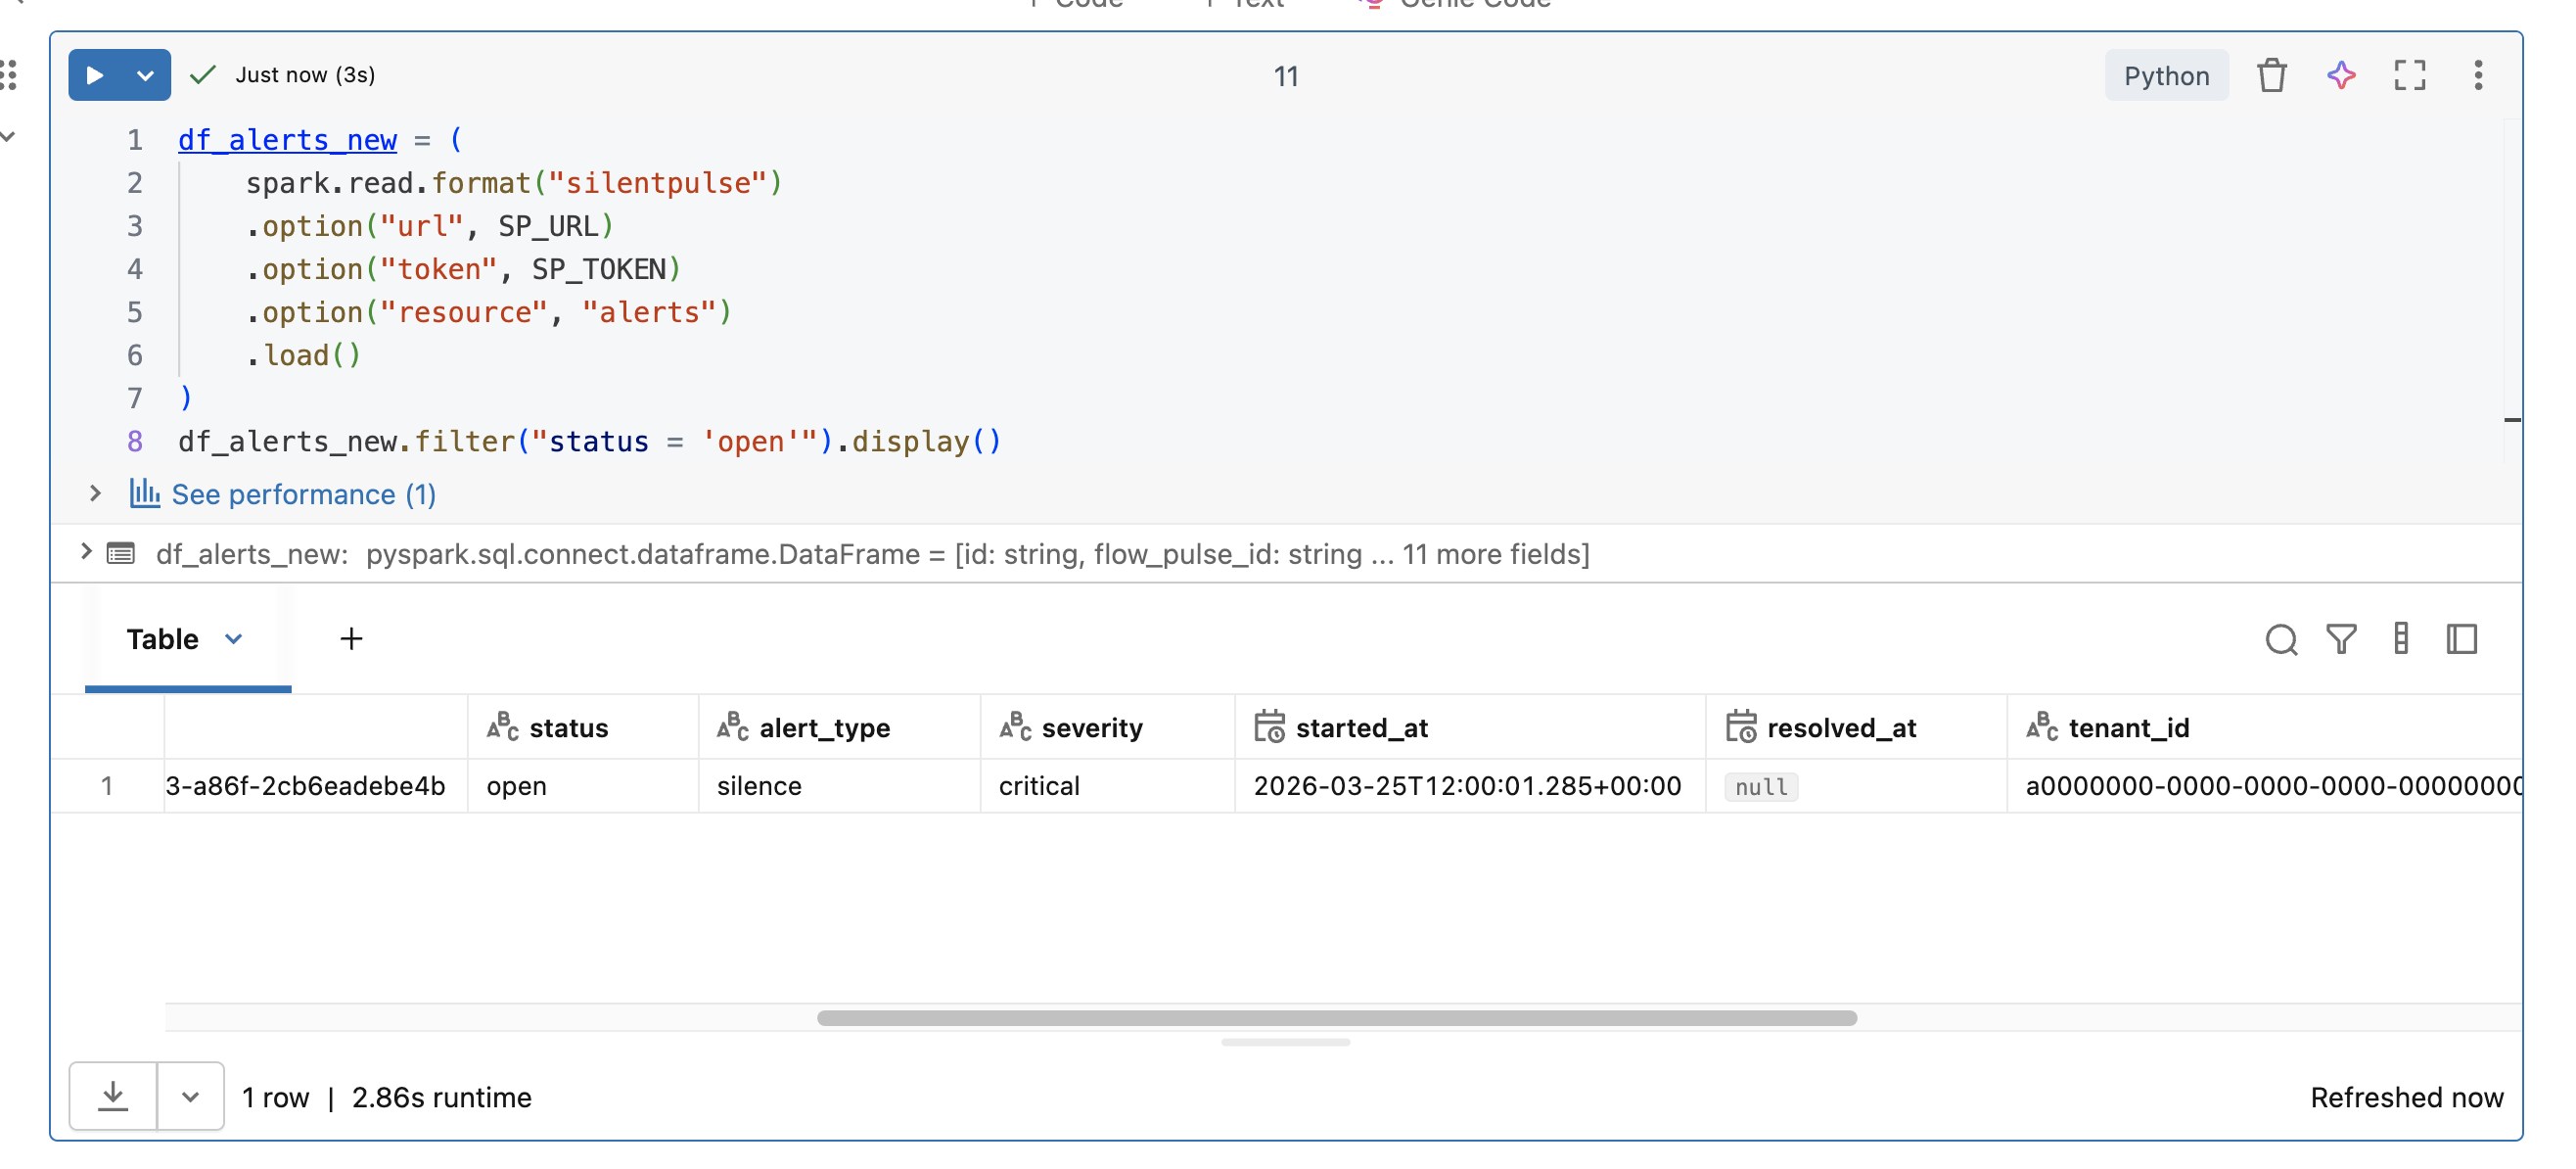
host3b: status active, alert_type silence. The pipeline never noticed. SilentPulse did.
Part 3: Pipeline observability with SDP decorators #
The DataSource reads from SilentPulse. The SDP package goes the other direction - it reports telemetry back to SilentPulse from your Spark pipelines.
|
|
|
|
Three decorators, one function:
|
|
Each decorator is non-blocking. They fire telemetry to SilentPulse’s ingest endpoint using a thread pool, so your pipeline doesn’t slow down. The decorators report:
- heartbeat - “this pipeline is alive and ran at this time”
- volume - “this run processed N rows” (alerts if below min_rows)
- completeness - “these columns exist and are not all null”
Now SilentPulse has visibility from both directions. It monitors whether sources are reporting (asset-level), and it receives heartbeats from your Databricks pipelines that process that data. If either side goes silent, you’ll know.
Streaming: foreachBatch telemetry #
The decorators above work great for batch tables. But if your SDP table returns a streaming DataFrame, operations like collect() and groupBy() fail, so the decorators fall back to heartbeat-only. You lose volume, completeness, and freshness signals.
Since v0.1.7, the SDP package ships streaming_sink() and report_batch() for foreachBatch integration. Spark calls your handler with each micro-batch as a regular DataFrame, so all aggregation works:
|
|
Each micro-batch reports heartbeat + volume per asset. Add expected_columns for completeness checks, max_delay_seconds for freshness. If you need to write the batch to a table alongside telemetry, use report_batch() inside your own handler:
|
|
Everything is exception-safe. If SilentPulse is unreachable or the DataFrame is empty, the pipeline continues without interruption.
Full SDP pipeline with foreachBatch sink #
Putting it all together - a complete Spark Declarative Pipeline that reads from Zerobus, builds a gold materialized view, and reports telemetry to SilentPulse in parallel:
|
|
The pipeline DAG shows the three components: streaming table feeding both the gold MV and the SilentPulse sink in parallel:
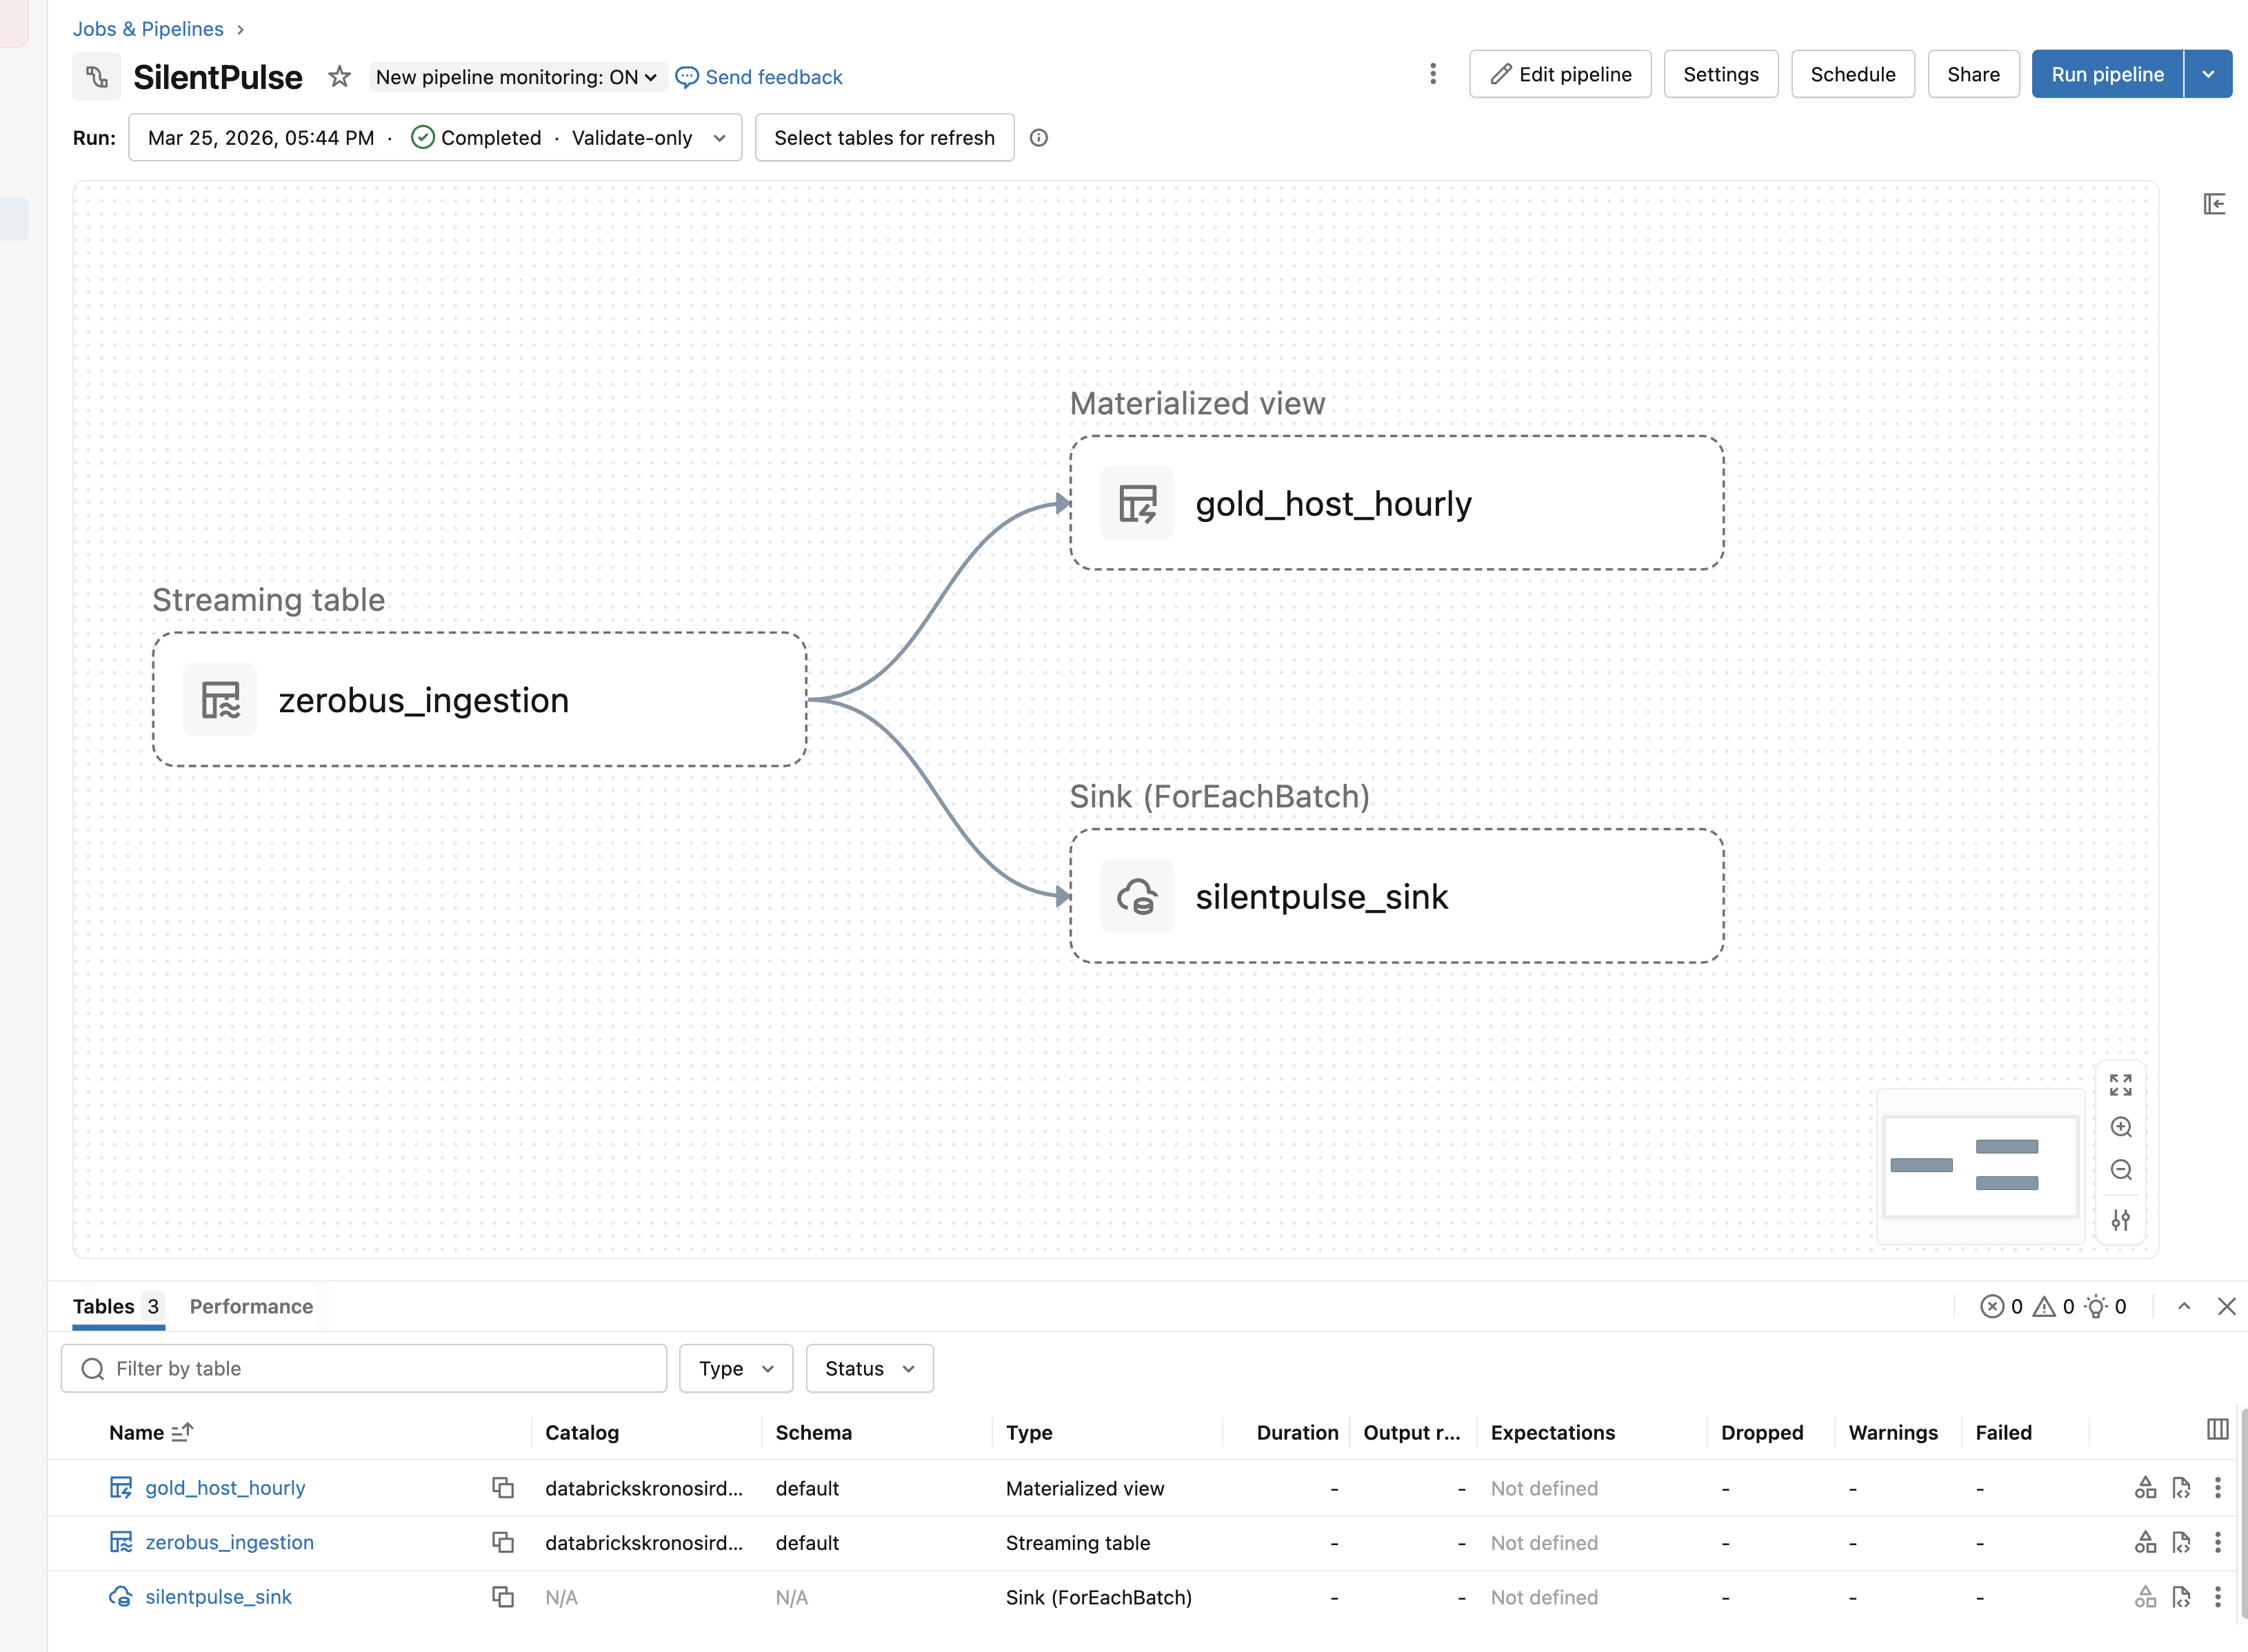
The foreach_batch_sink is a first-class SDP construct. It handles checkpointing, retries, and lifecycle automatically. Each micro-batch flows through report_batch() which sends per-asset heartbeat, volume, completeness, and freshness telemetry to SilentPulse without blocking the pipeline.
Part 4: Metric Views for visibility KPIs #
Raw data is useful. Governed metrics are better. Unity Catalog Metric Views (available on DBR 17.2+) let you define reusable measures in YAML and query them with MEASURE().
I built two metric views for SilentPulse data. The SQL to deploy them:
|
|
The metric view separates what you measure from how you group it. The same Blind Spot Hours measure works whether you group by severity, by asset group, by week, or by all three at once.
Query it:
|
|
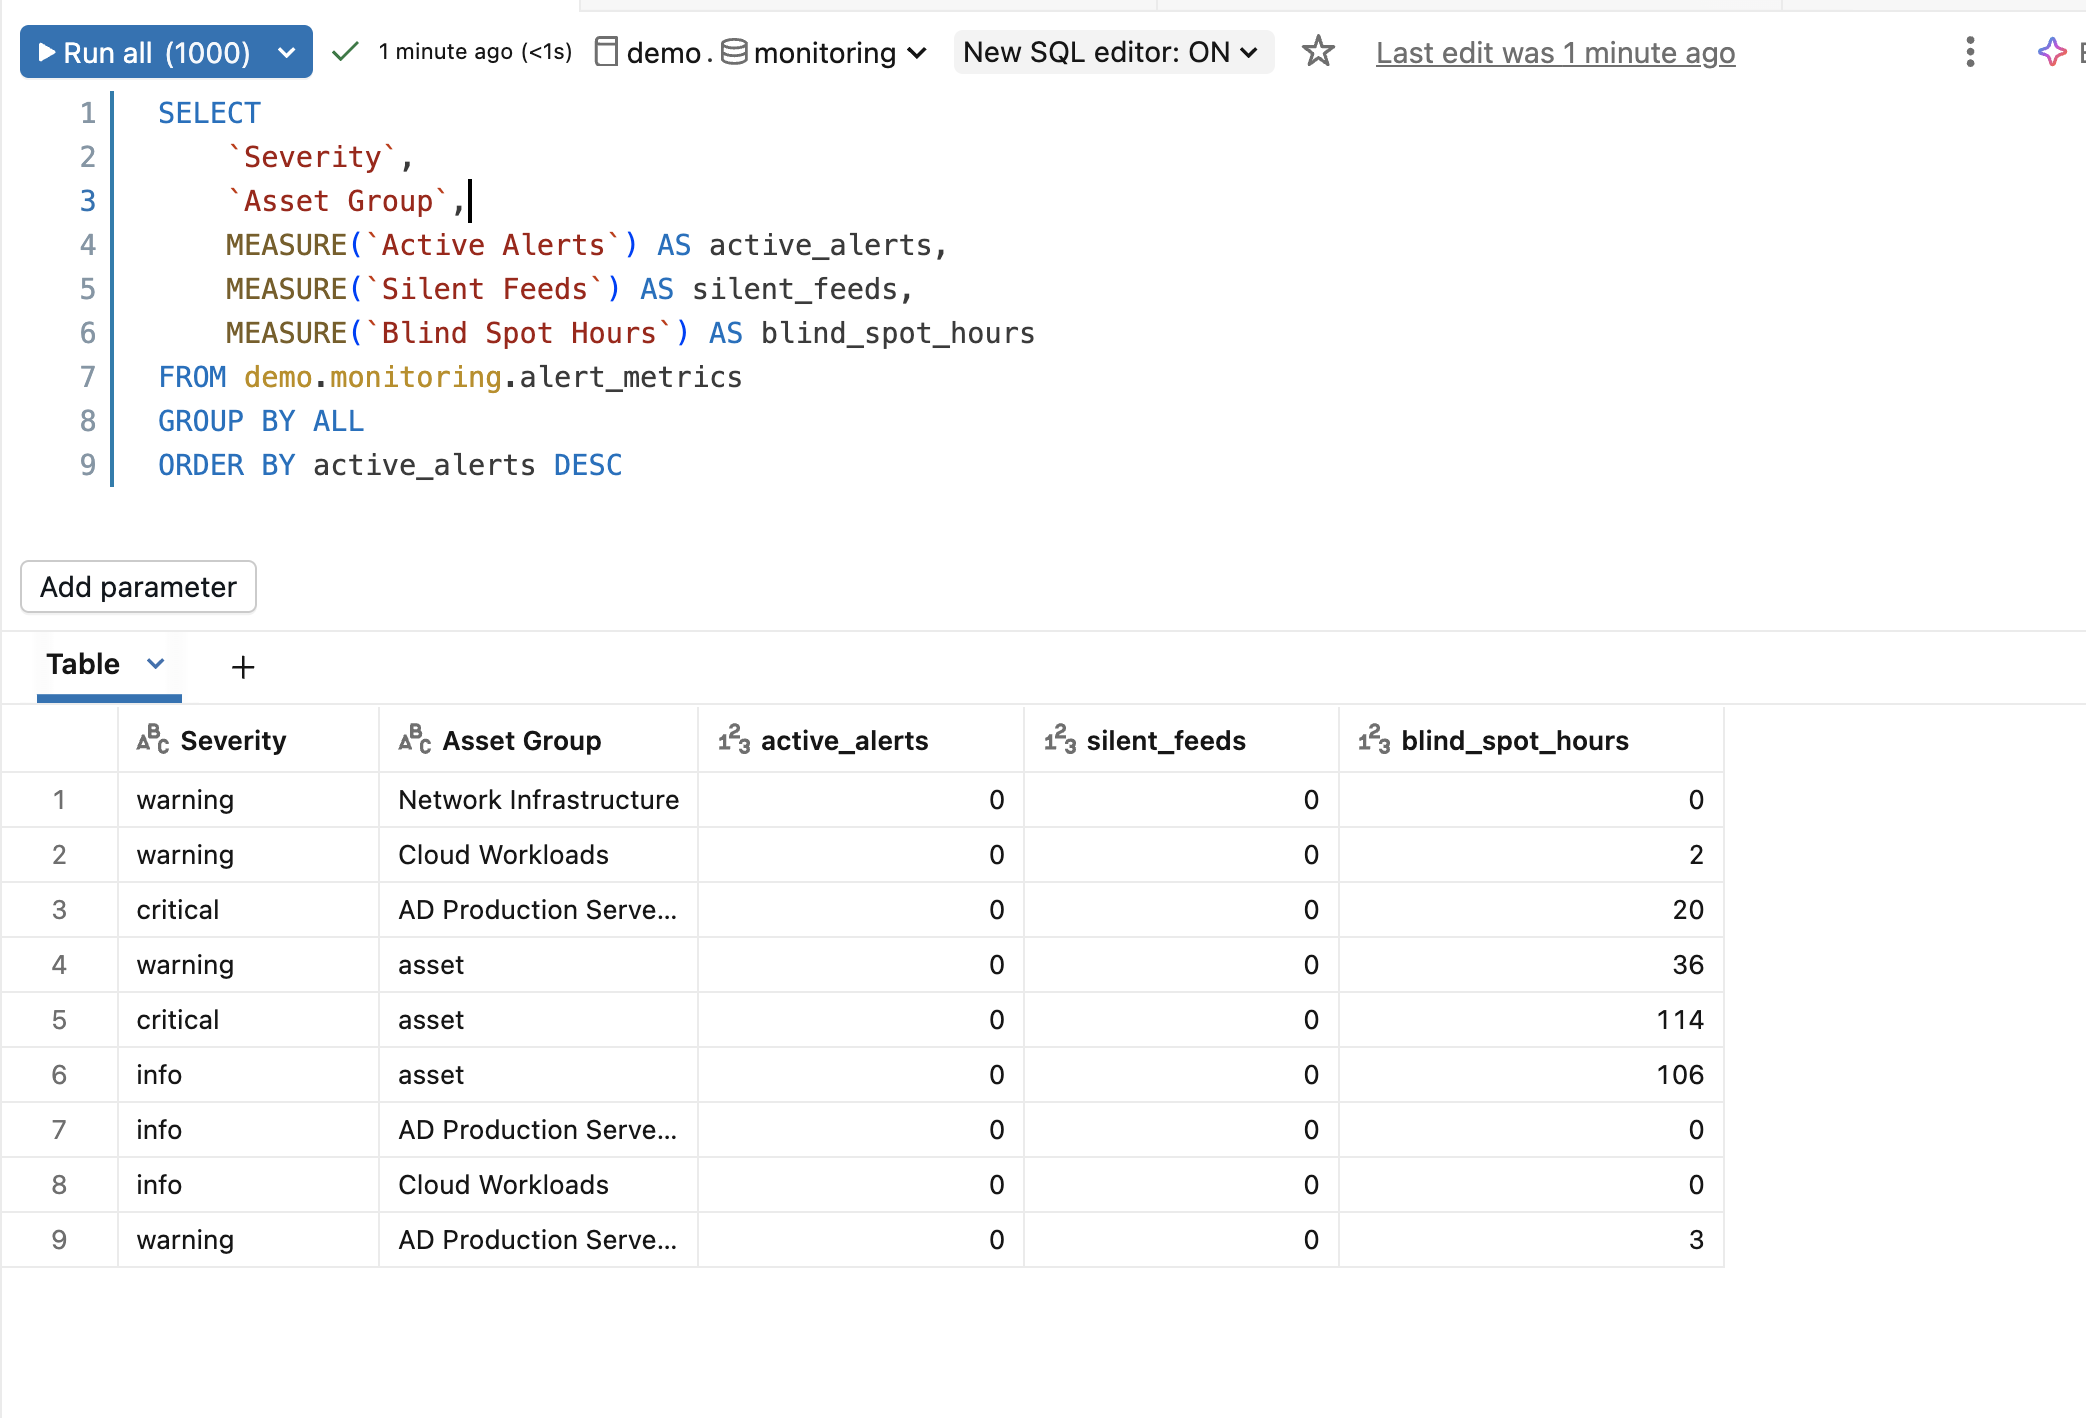
A second metric view covers feed health with measures like Total Assets and Coverage Pct, using the same pattern against silentpulse.monitoring.coverage.
These metrics are first-class objects in Unity Catalog. They show up in Catalog Explorer with their dimensions and measures listed. They work natively with AI/BI Dashboards and Genie Spaces. And because they’re governed by UC, access controls apply automatically.
Part 5: AI-powered root cause analysis #
An alert tells you that host3b went silent. It doesn’t tell you why. Was it a network outage? A credential rotation? A pipeline failure? A decommissioned host?
Databricks AI Functions answer that question with one SQL call. No model to deploy, no endpoint to manage, no GPU to provision.
|
|
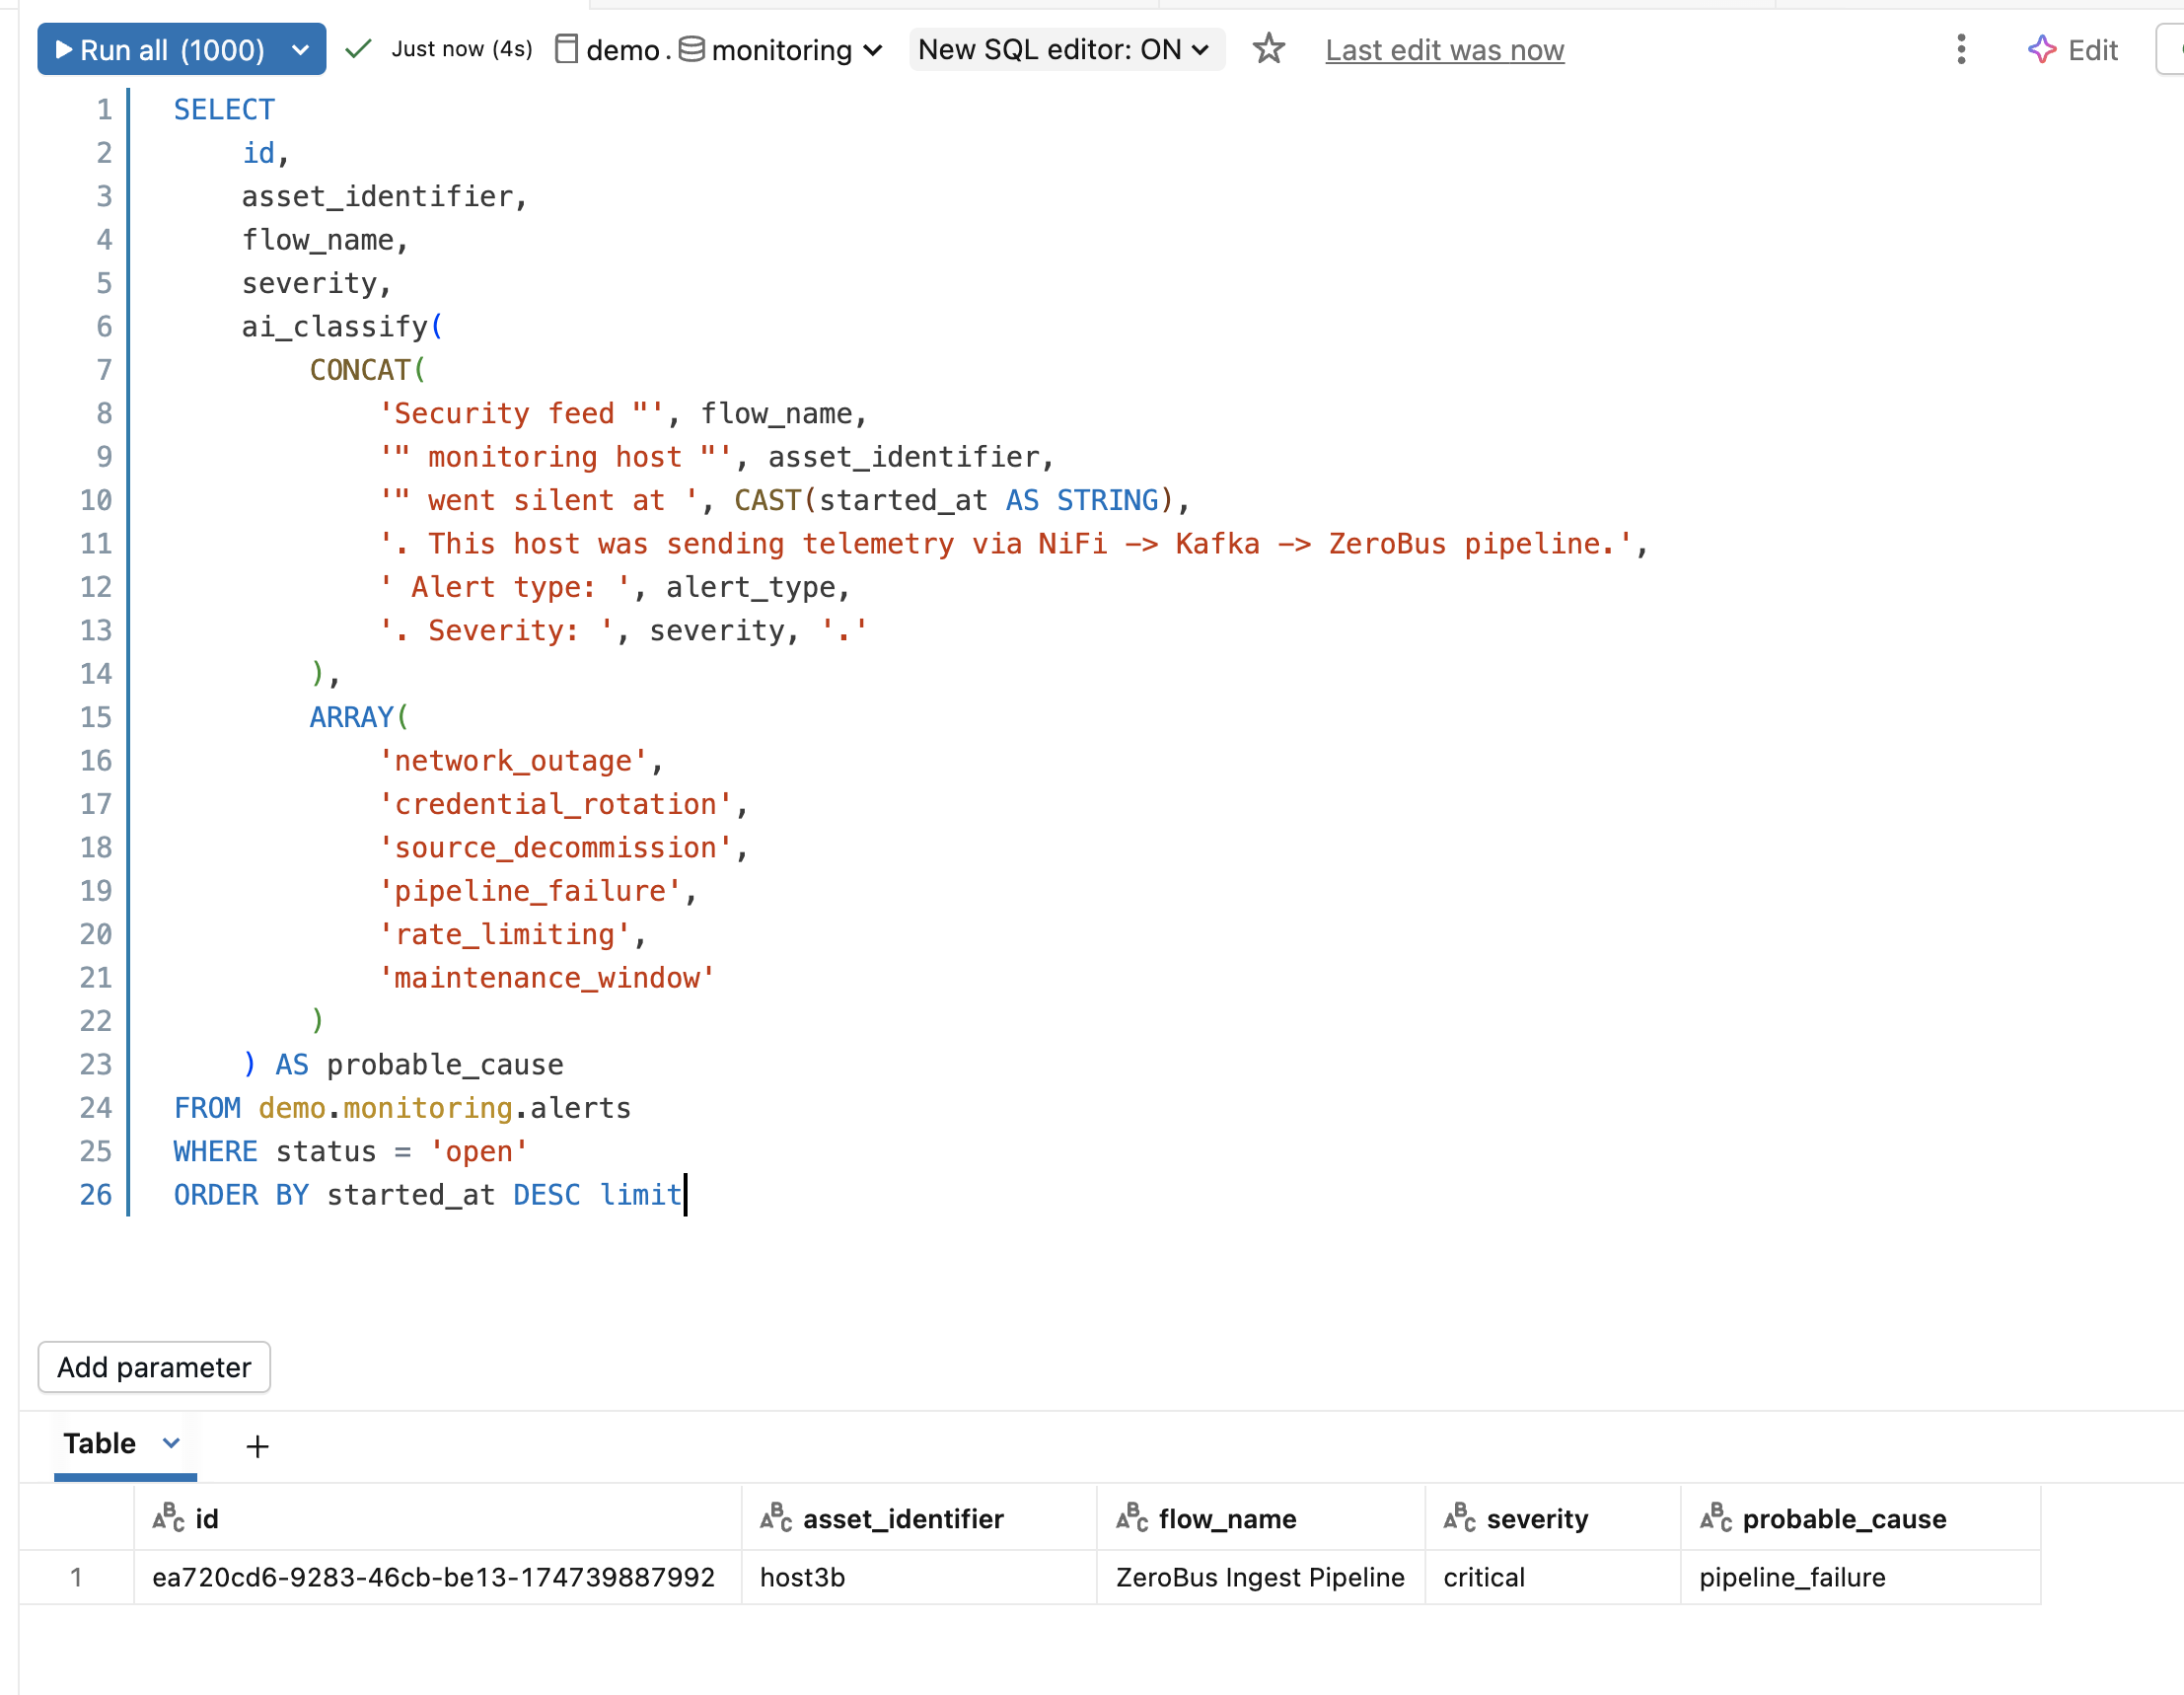
ai_classify takes a text description and a set of labels, and returns the most likely match. For host3b, which we know stopped because we killed the NiFi processor, it returns pipeline_failure. No model training. No prompt engineering. One function call.
For an executive summary across all active alerts:
|
|
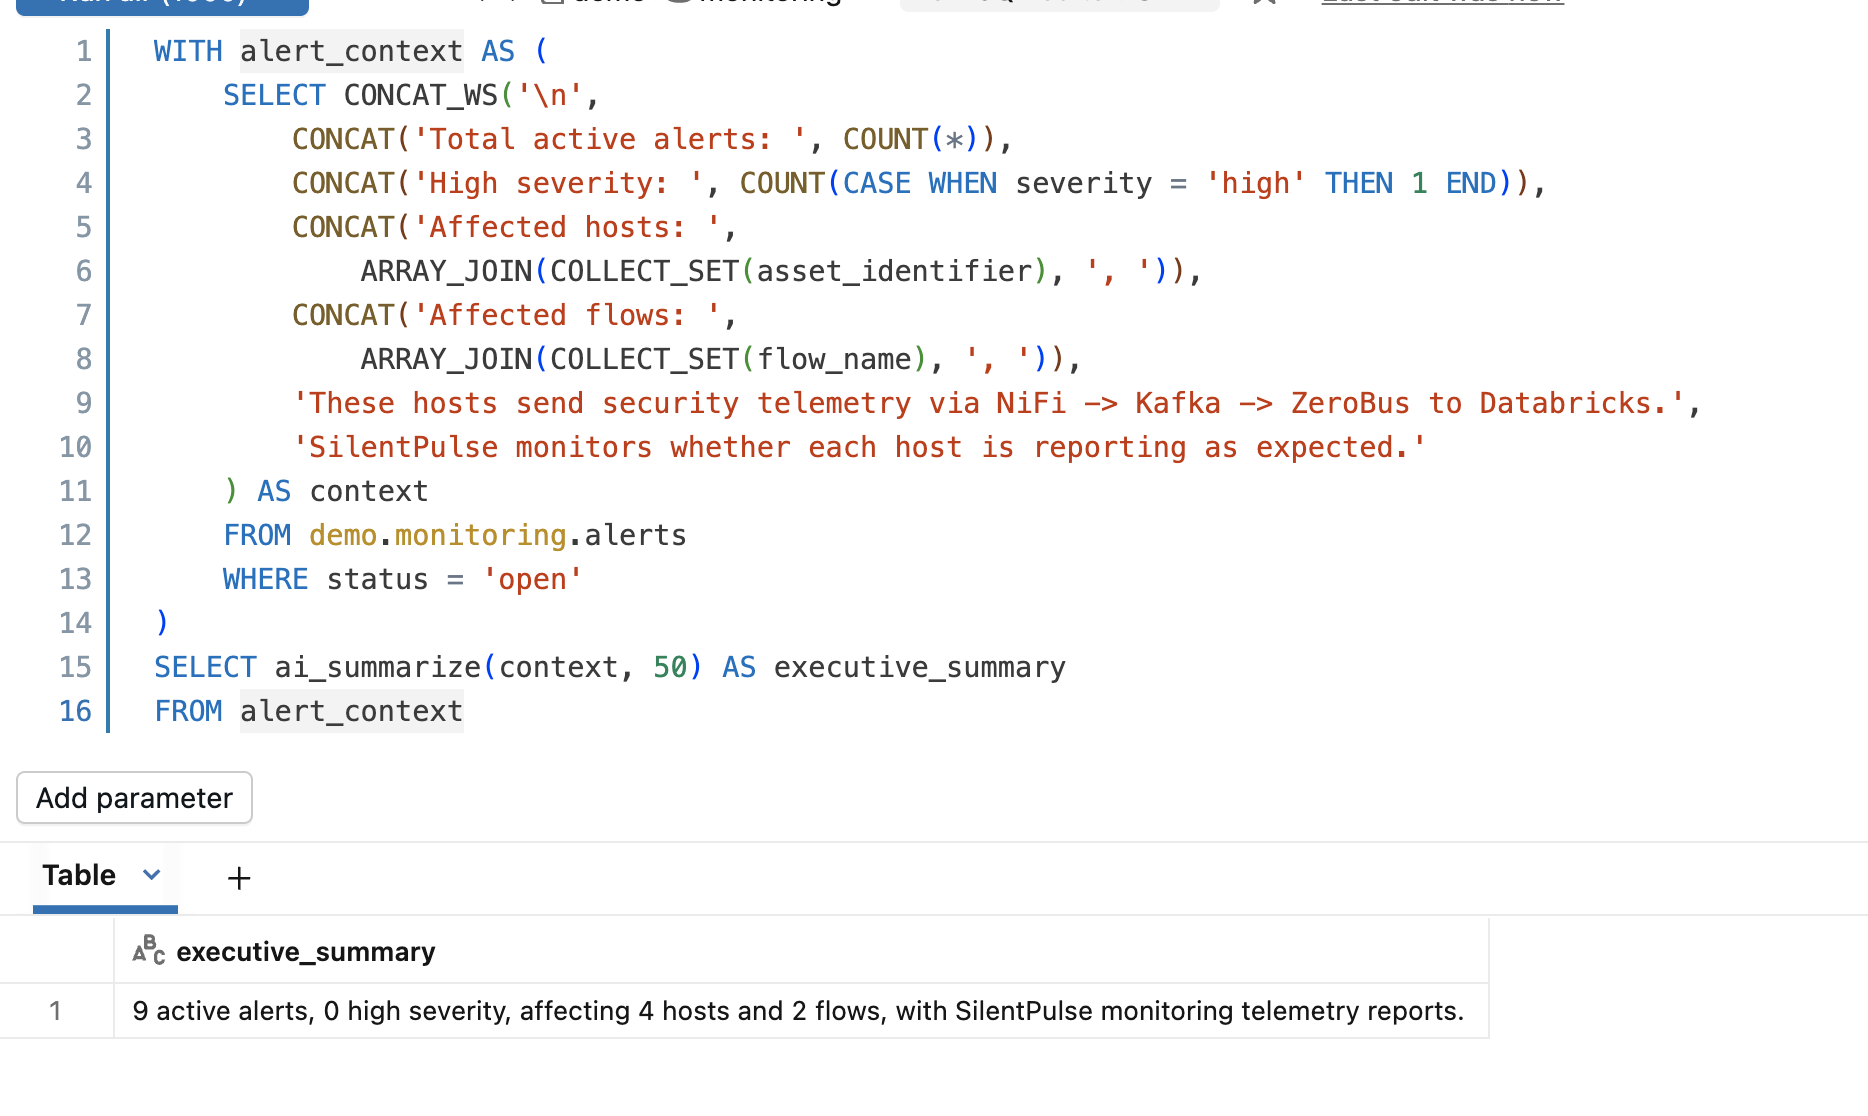
One paragraph that your CISO can read. Generated from live data, not a static report.
Persisting enriched data #
For dashboards and automation, materialize the AI-enriched alerts:
|
|
Now you have a Delta table with AI-classified root causes that updates on every refresh. Dashboards, alerts, notebooks - all can query it directly.
Part 6: The dashboard #
Everything above feeds into an AI/BI Dashboard. KPI counters at the top, charts in the middle, detail tables at the bottom. All querying the same Delta tables and metric views.
Row 1 - KPI cards:
- Active Alerts (counter)
- Blind Spot Hours (counter)
- Affected Hosts (counter)
Row 2 - Charts:
- Root Cause Distribution (pie chart from
alerts_enriched) - Severity Breakdown by Cause (stacked bar)
Row 3 - Detail:
- Top Affected Hosts (table with event counts and alert status)
- AI Insights with recommended actions
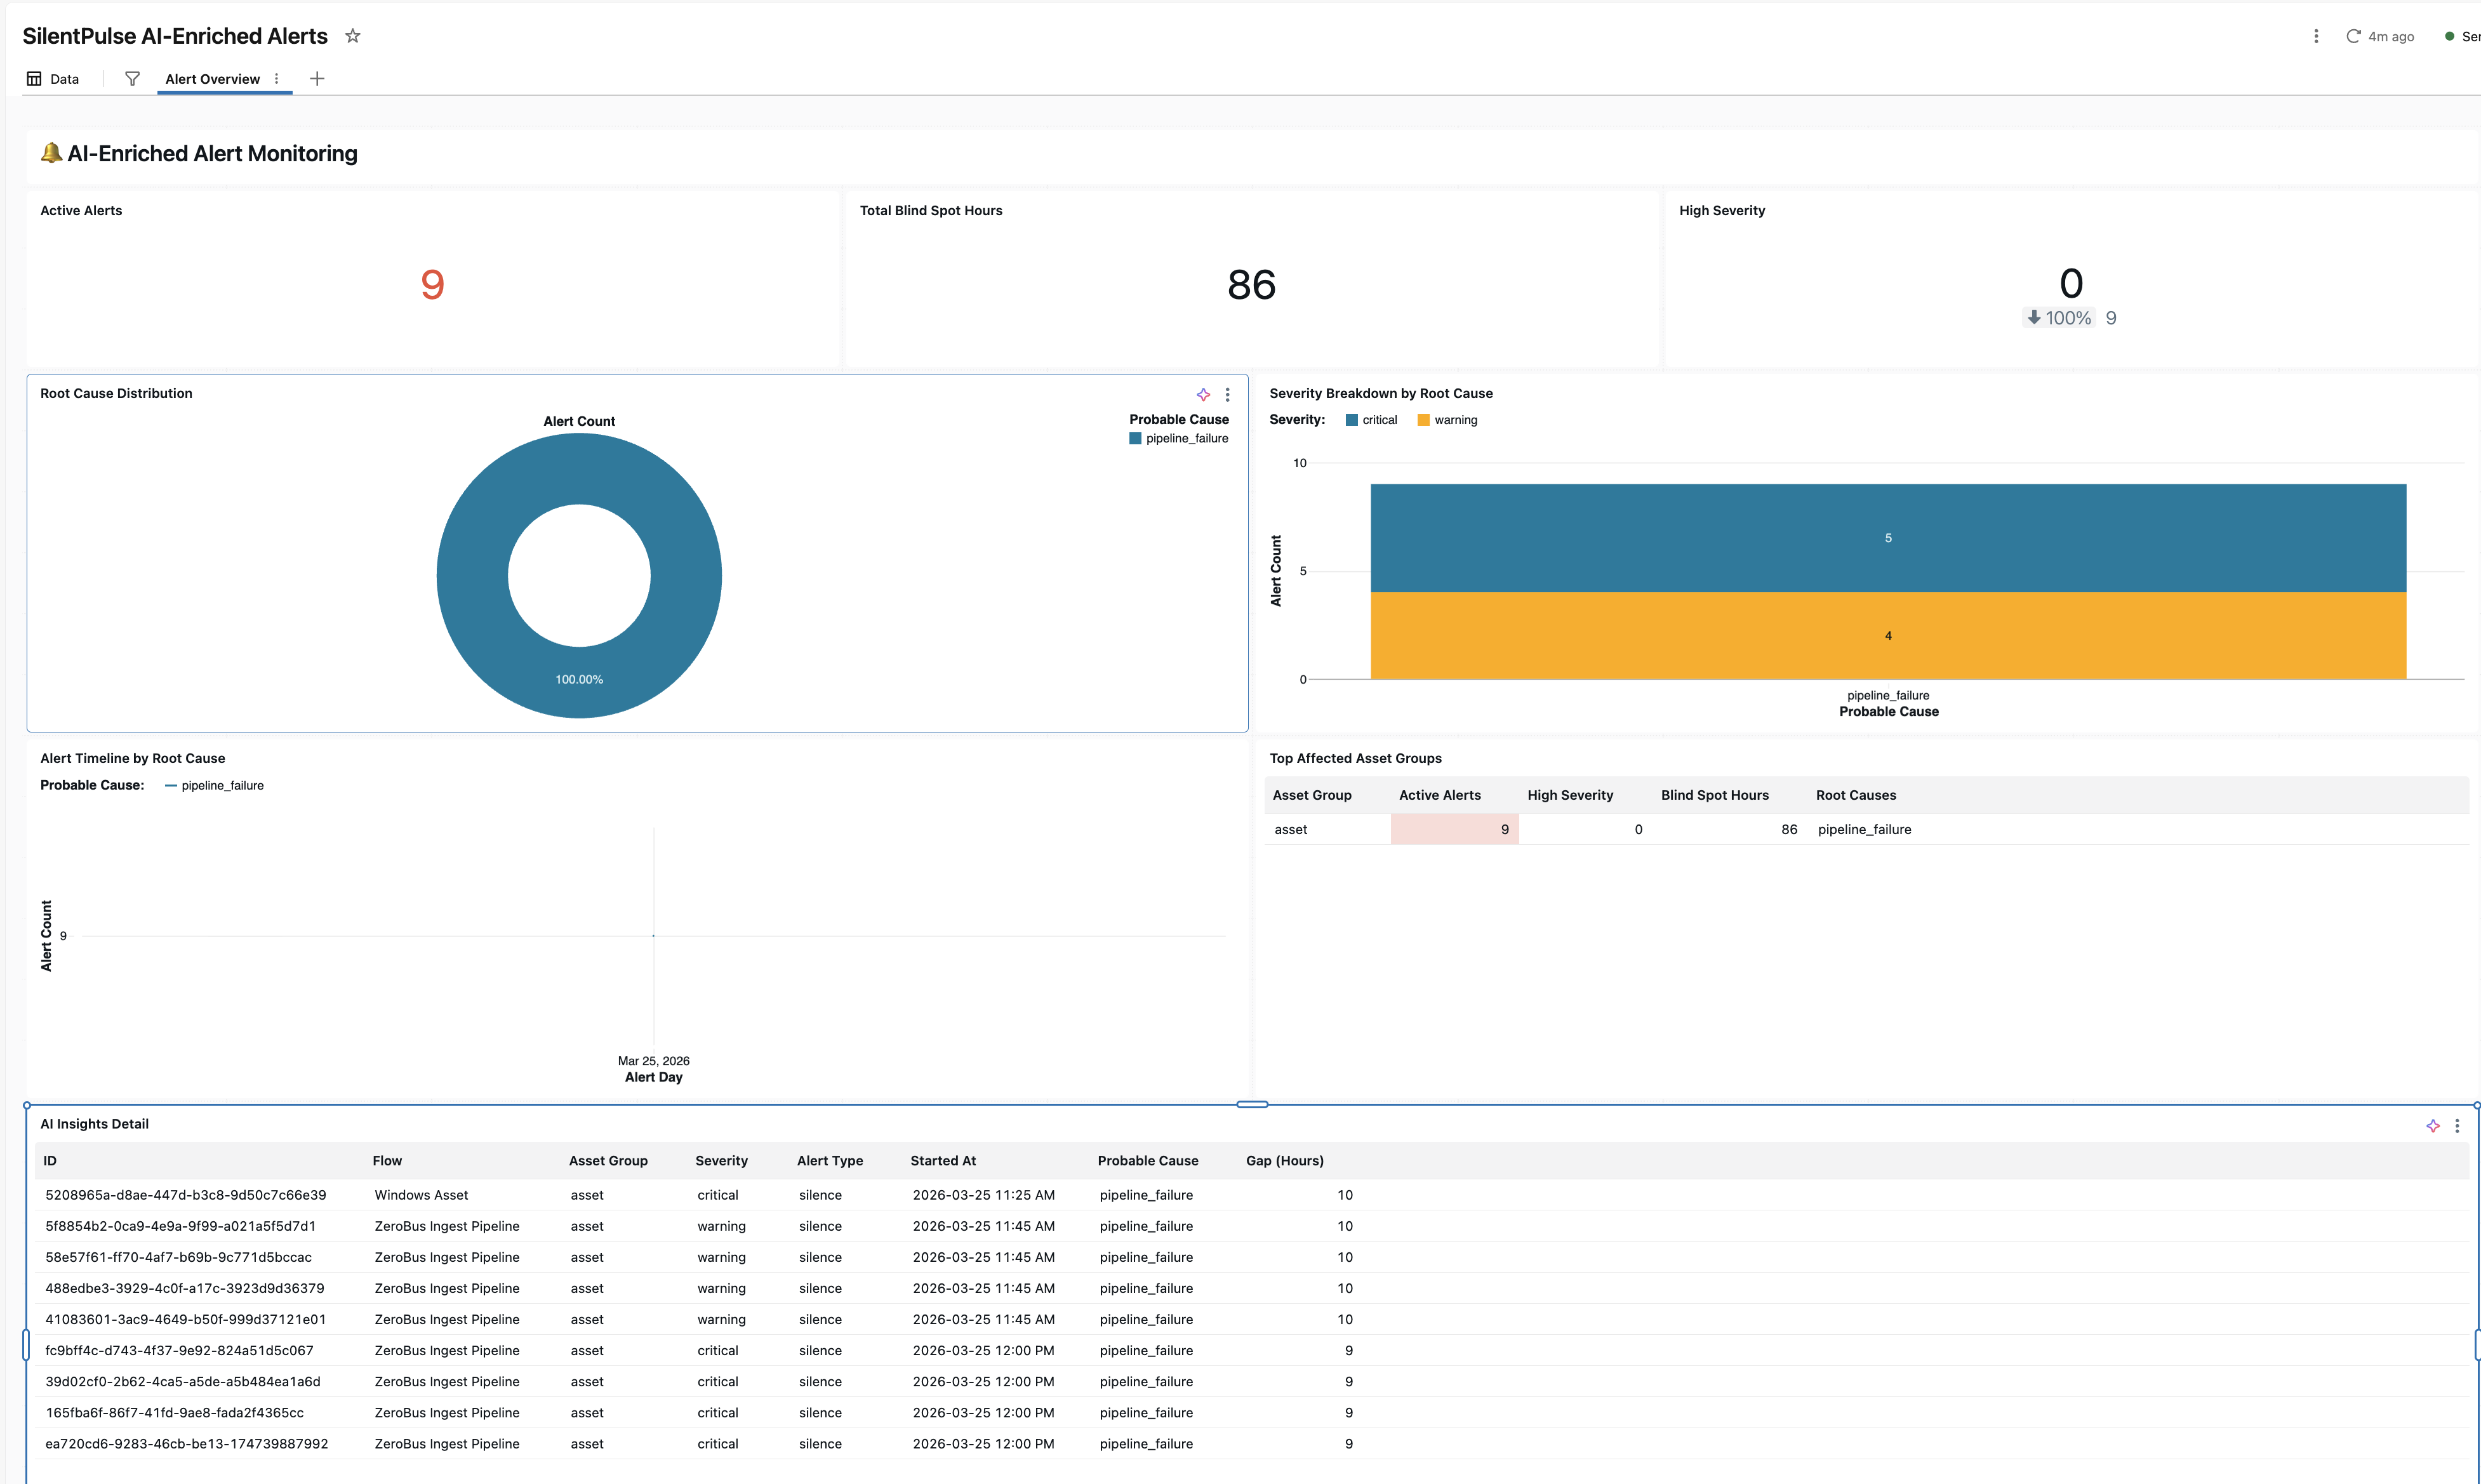
The dashboard is backed by six SQL queries. The full query set is in the repo at examples/dashboards/ai-enriched-alerts.sql.
Part 7: Natural language queries with Genie #
The final layer. A Genie Space configured with the SilentPulse tables and metric views, where anyone can ask questions in plain English.
|
|
Ask “Which security feeds went silent in the last 24 hours?” and Genie translates it to SQL, returns a result table with flow names, asset groups and alert counts, and even generates a bar chart breakdown:
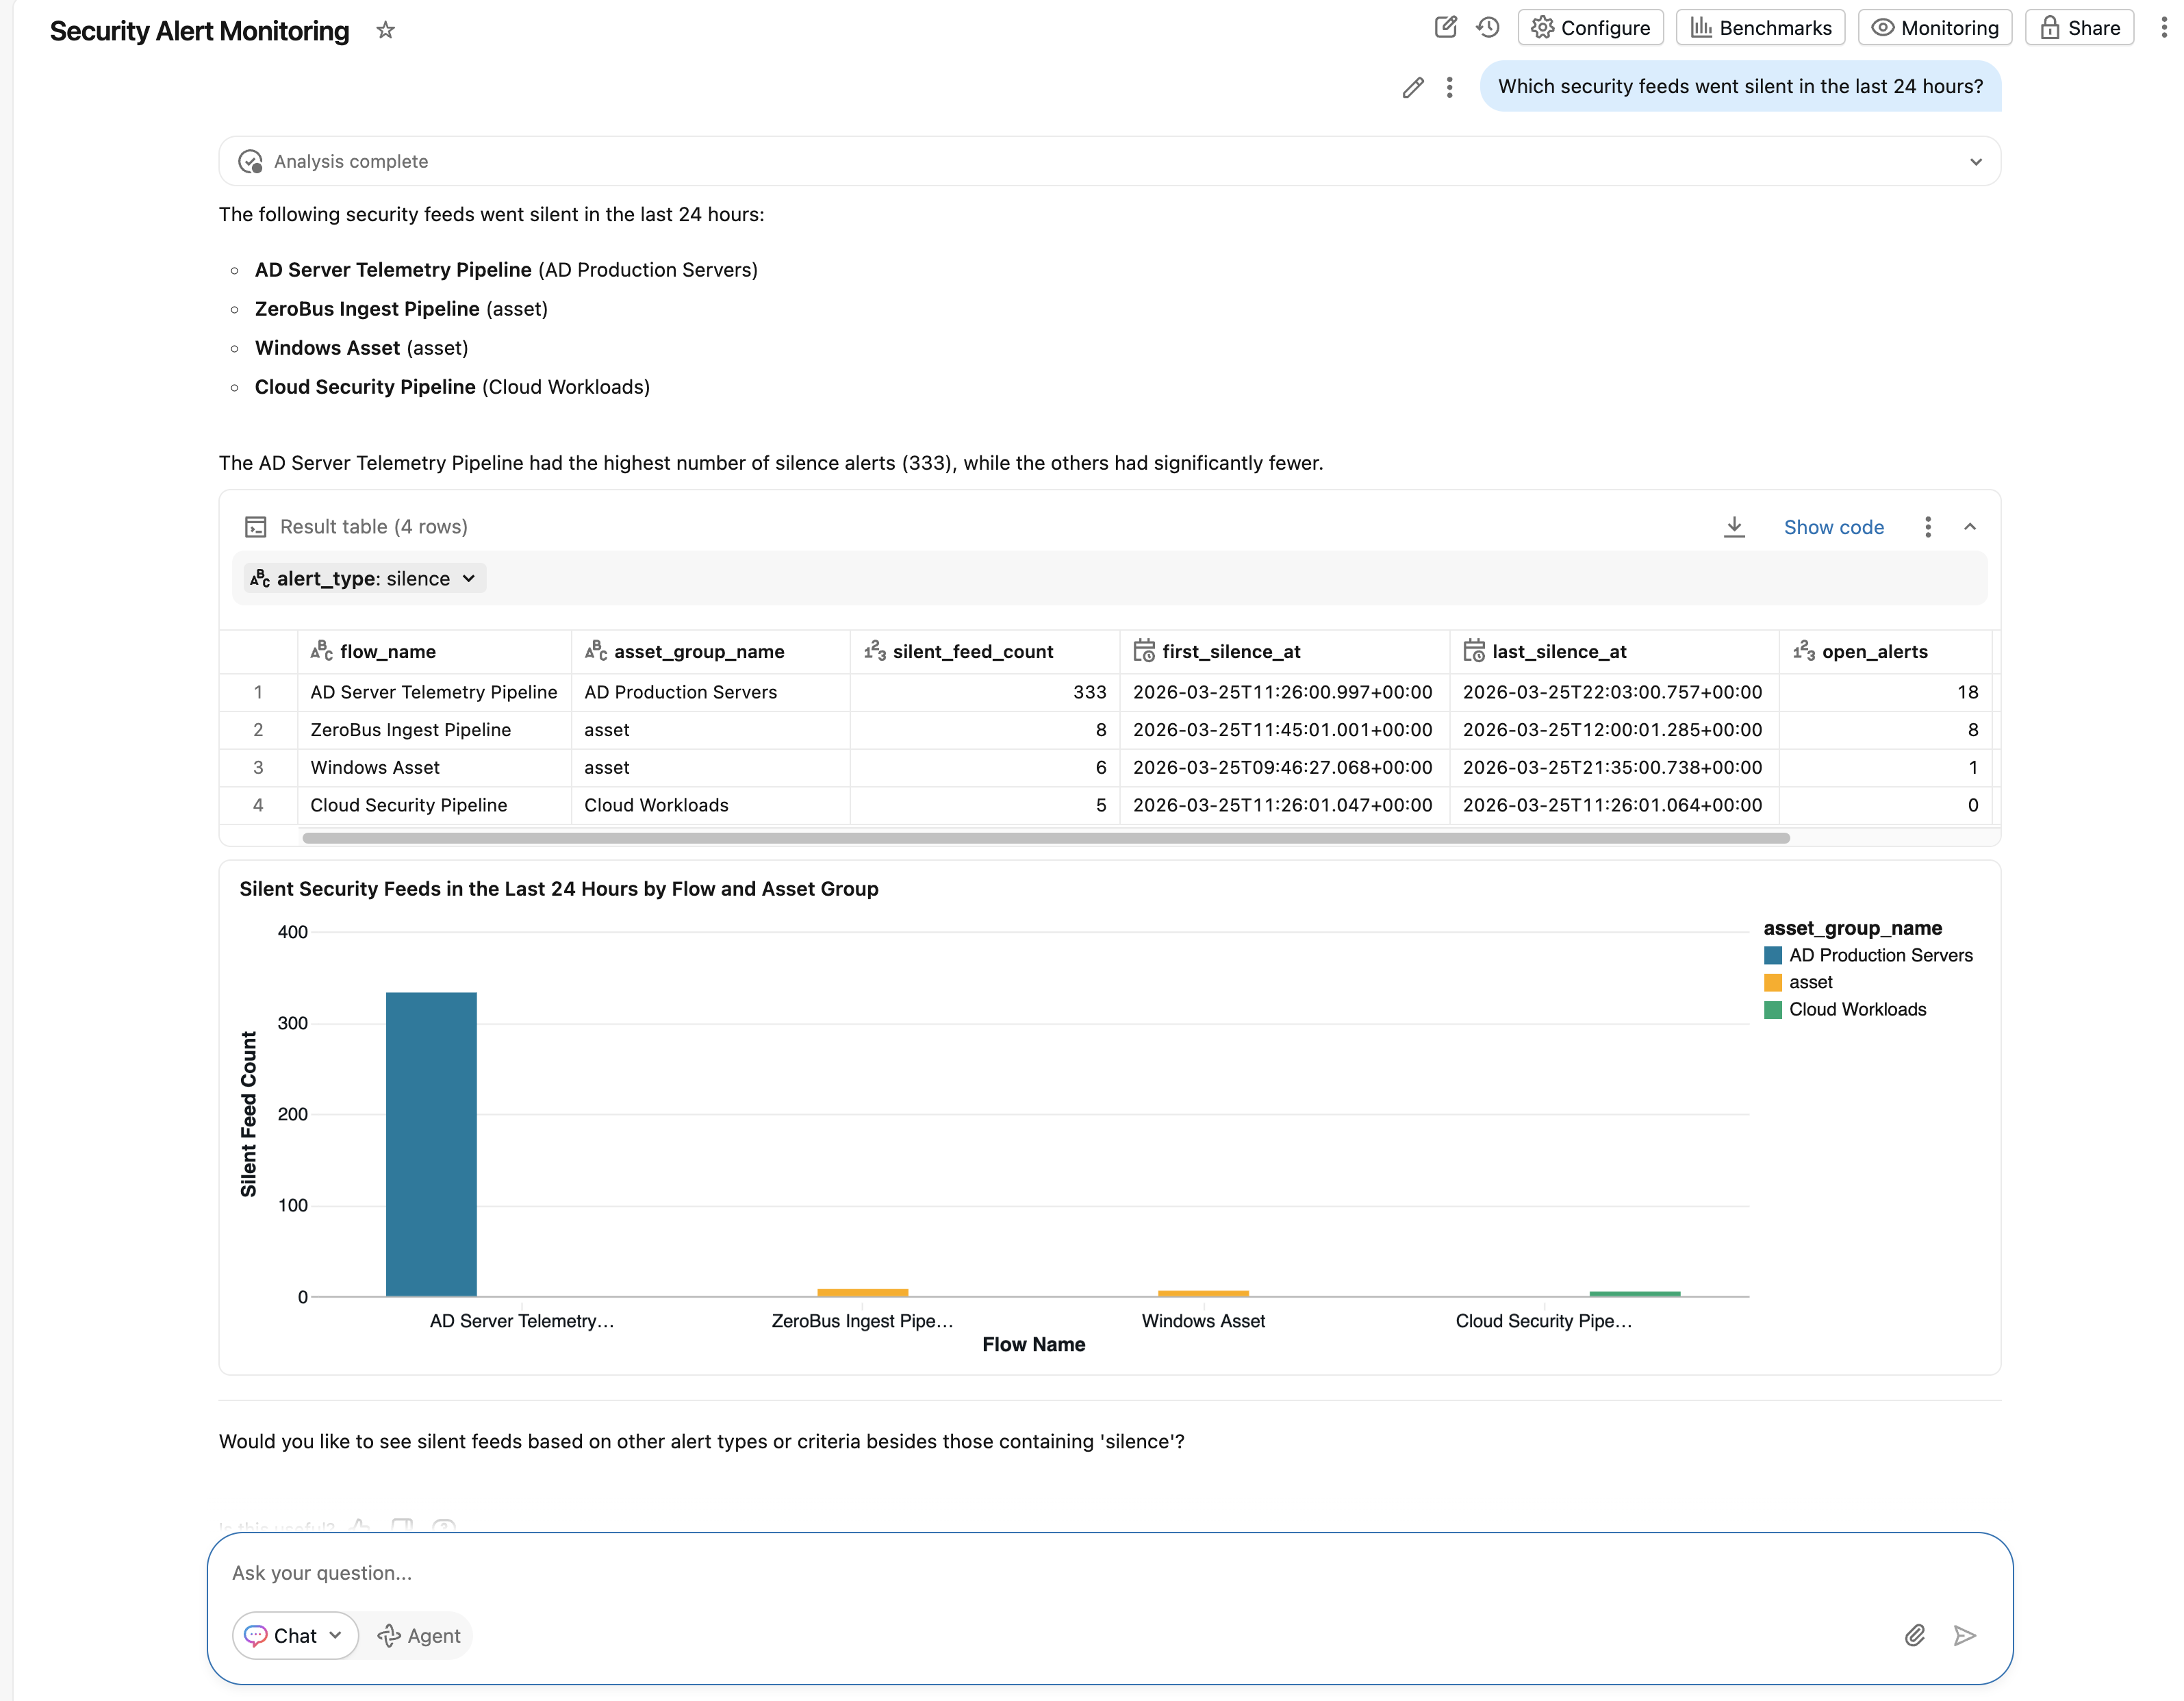
The metric views make Genie’s answers more accurate because the metrics are pre-defined. Genie doesn’t have to guess how to calculate “blind spot hours” - it uses MEASURE() on the metric view directly.
The complete picture #
Here’s what the full stack looks like:
flowchart TB
    subgraph Sources["Security Telemetry"]
        H1["host1"] & H2["host2"] & H3["host3a"] & H4["host3b"]
    end

    subgraph NiFi["Apache NiFi"]
        MC["MergeContent"] --> ZB["PutZerobusIngest"]
    end

    subgraph Databricks["Databricks Lakehouse"]
        Delta["demo.default.zerobus_ingestion\n(Delta Table)"]
        SP_Tables["silentpulse.monitoring.*\n(Alerts, Flows, Coverage)"]
        MV["Metric Views\n(Alert KPIs, Feed Health)"]
        AI["AI Functions\n(ai_classify, ai_summarize)"]
        Dash["AI/BI Dashboard"]
        Genie["Genie Space"]
    end

    subgraph SilentPulse["SilentPulse"]
        Monitor["Asset-level\nMonitoring"]
        API["REST API"]
    end

    Sources --> MC
    ZB --> Delta
    Monitor -->|"silence detection"| API
    API -->|"spark.read.format('silentpulse')"| SP_Tables
    SP_Tables --> MV
    SP_Tables --> AI
    AI --> Dash
    MV --> Dash
    MV --> Genie

    Delta -.->|"SDP decorators + foreachBatch\n(heartbeat, volume, freshness)"| API

    style Monitor fill:#6366f1,color:#fff
    style AI fill:#6366f1,color:#fff
    style MV fill:#10b981,color:#fff
Three monitoring layers, each catching different problems:
| Layer | What it catches | Example |
|---|---|---|
| SDP | Pipeline failures, schema drift, data quality | Column went NULL, job crashed, throughput dropped |
| Lakewatch | Threats in arriving data | Brute force, lateral movement, exfiltration |
| SilentPulse | Sources that stopped reporting | One host of a thousand went dark, credential expired, agent crashed |
SDP and Lakewatch work on data that arrives. SilentPulse watches for data that doesn’t.
Running the demo yourself #
Everything you need:
- Databricks workspace with DBR 15.4+ and a Pro/Serverless SQL Warehouse (17.2+ for Metric Views)
- SilentPulse instance monitoring your data sources (or the hosted demo)
- Wheels from GitHub Release v0.1.7 uploaded to a UC Volume
|
|
Upload the three wheels, install them, and follow the notebooks in examples/. The metric view SQL is at examples/metric-views/deploy-metric-views.sql. The dashboard queries are at examples/dashboards/ai-enriched-alerts.sql.
The full repo: github.com/silentpulse-io/silentpulse-databricks
What’s next #
The SDP package now supports both batch decorators and streaming via foreachBatch, so you get full per-asset telemetry regardless of how your pipeline runs. The DataSource handles batch reads and streaming reads for alerts, plus streaming writes for telemetry ingest.
UC Discovery is the next piece - automatically scanning Unity Catalog for tables that should have asset-level monitoring and suggesting SilentPulse configurations. If you have 200 Delta tables with a host or source_ip column, you probably want to know when one of those sources stops appearing.
The Databricks ecosystem keeps getting deeper. Lakewatch for detection. SDP for pipeline health. AI Functions for classification. Metric Views for governed KPIs. Genie for natural language access. The integration points are there. The missing piece was someone watching whether the sources feeding all of this are actually reporting.
That’s SilentPulse. See when security goes silent.
Links:
- silentpulse-databricks - Integration repo (Apache 2.0)
- SilentPulse - Project homepage
- Databricks Lakewatch announcement
- Zerobus Ingest + NiFi - Previous post on the data pipeline
- Metric Views documentation
- AI Functions documentation
